|
Download Data (XLS File) |
|
||||||||
|
||||||||
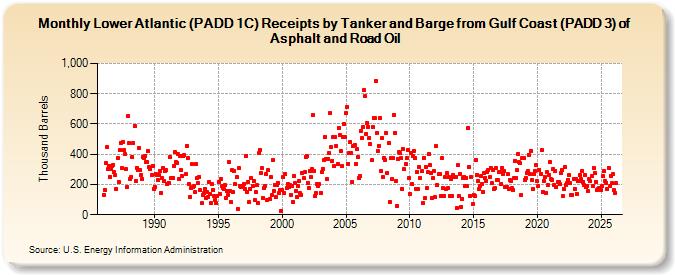
| Lower Atlantic (PADD 1C) Receipts by Tanker and Barge from Gulf Coast (PADD 3) of Asphalt and Road Oil (Thousand Barrels) | ||||||||
| Year | Jan | Feb | Mar | Apr | May | Jun | Jul | Aug | Sep | Oct | Nov | Dec |
|---|---|---|---|---|---|---|---|---|---|---|---|---|
| 1986 | 133 | 165 | 339 | 447 | 302 | 325 | 252 | 301 | 320 | 331 | 282 | 260 |
| 1987 | 173 | 377 | 218 | 426 | 477 | 310 | 482 | 425 | 401 | 299 | 180 | 652 |
| 1988 | 474 | 237 | 250 | 381 | 474 | 586 | 225 | 311 | 297 | 444 | 297 | 263 |
| 1989 | 235 | 383 | 374 | 390 | 349 | 347 | 418 | 314 | 300 | 260 | 324 | 172 |
| 1990 | 184 | 270 | 264 | 230 | 265 | 289 | 146 | 242 | 310 | 221 | 288 | 294 |
| 1991 | 200 | 213 | 379 | 241 | 245 | 243 | 323 | 413 | 346 | 345 | 399 | 237 |
| 1992 | 387 | 293 | 255 | 385 | 393 | 267 | 457 | 372 | 203 | 118 | 176 | 333 |
| 1993 | 183 | 192 | 149 | 334 | 241 | 208 | 252 | 161 | 75 | 129 | 141 | 168 |
| 1994 | 110 | 148 | 119 | 215 | 140 | 75 | 203 | 166 | 124 | 99 | 75 | 123 |
| 1995 | 215 | 139 | 235 | 188 | 178 | 173 | 198 | 110 | 159 | 131 | 346 | 154 |
| 1996 | 83 | 294 | 148 | 292 | 200 | 251 | 38 | 307 | 188 | 186 | 187 | 191 |
| 1997 | 201 | 171 | 390 | 151 | 218 | 82 | 171 | 240 | 189 | 222 | 97 | 153 |
| 1998 | 194 | 75 | 405 | 429 | 278 | 306 | 112 | 178 | 192 | 268 | 98 | 295 |
| 1999 | 105 | 248 | 129 | 363 | 159 | 195 | 114 | 194 | 212 | 143 | 163 | 27 |
| 2000 | 162 | 247 | 143 | 269 | 174 | 202 | 186 | 195 | 131 | 189 | 84 | 258 |
| 2001 | 207 | 156 | 118 | 187 | 225 | 141 | 133 | 275 | 241 | 281 | 384 | 387 |
| 2002 | 211 | 176 | 291 | 251 | 299 | 661 | 291 | 123 | 141 | 200 | 188 | 203 |
| 2003 | 144 | 283 | 301 | 362 | 514 | 368 | 234 | 371 | 408 | 674 | 447 | 358 |
| 2004 | 515 | 323 | 515 | 454 | 336 | 573 | 525 | 420 | 324 | 516 | 601 | 513 |
| 2005 | 672 | 715 | 338 | 408 | 481 | 407 | 217 | 453 | 461 | 338 | 432 | 382 |
| 2006 | 243 | 254 | 552 | 505 | 579 | 825 | 783 | 536 | 609 | 581 | 509 | 467 |
| 2007 | 360 | 583 | 638 | 638 | 886 | 541 | 420 | 456 | 639 | 289 | 508 | 249 |
| 2008 | 372 | 365 | 541 | 275 | 473 | 87 | 374 | 236 | 375 | 661 | 542 | 226 |
| 2009 | 56 | 370 | 413 | 405 | 373 | 172 | 432 | 300 | 334 | 372 | 428 | 242 |
| 2010 | 139 | 405 | 201 | 388 | 423 | 375 | 169 | 283 | 168 | 317 | 242 | 286 |
| 2011 | 77 | 374 | 110 | 318 | 176 | 281 | 403 | 328 | 278 | 110 | 242 | 286 |
| 2012 | 115 | 452 | 194 | 267 | 268 | 124 | 372 | 176 | 124 | 250 | 173 | 273 |
| 2013 | 174 | 248 | 124 | 237 | 125 | 262 | 248 | 249 | 45 | 326 | 122 | 268 |
| 2014 | 50 | 107 | 246 | 250 | 192 | 245 | 187 | 573 | 318 | 126 | 248 | 69 |
| 2015 | 131 | 121 | 364 | 265 | 225 | 167 | 191 | 254 | 204 | 153 | 273 | 245 |
| 2016 | 223 | 283 | 295 | 247 | 311 | 208 | 294 | 172 | 174 | 308 | 229 | 227 |
| 2017 | 281 | 284 | 204 | 308 | 270 | 286 | 182 | 182 | 268 | 171 | 230 | 222 |
| 2018 | 174 | 164 | 241 | 357 | 246 | 294 | 404 | 347 | 339 | 131 | 374 | 375 |
| 2019 | 228 | 246 | 278 | 288 | 398 | 267 | 421 | 232 | 168 | 272 | 288 | 330 |
| 2020 | 222 | 189 | 296 | 272 | 427 | 151 | 223 | 252 | 144 | 282 | 195 | 261 |
| 2021 | 348 | 234 | 232 | 302 | 197 | 290 | 184 | 218 | 218 | 200 | 274 | 296 |
| 2022 | 121 | 169 | 316 | 197 | 208 | 232 | 261 | 207 | 129 | 130 | 235 | 173 |
| 2023 | 237 | 139 | 220 | 226 | 262 | 236 | 286 | 215 | 194 | 262 | 182 | 193 |
| 2024 | 154 | |||||||||||
| - = No Data Reported; -- = Not Applicable; NA = Not Available; W = Withheld to avoid disclosure of individual company data. |
| Release Date: 3/29/2024 |
| Next Release Date: 4/30/2024 |