|
Download Data (XLS File) |
|
||||||||
|
||||||||
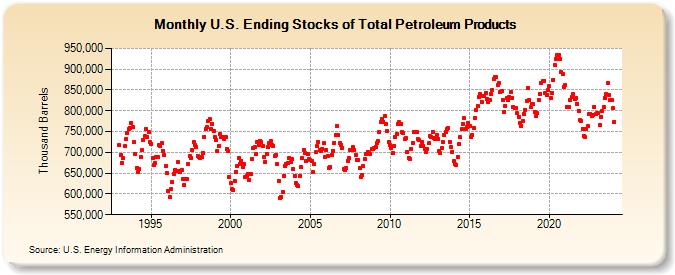
| U.S. Ending Stocks of Total Petroleum Products (Thousand Barrels) | ||||||||
| Year | Jan | Feb | Mar | Apr | May | Jun | Jul | Aug | Sep | Oct | Nov | Dec |
|---|---|---|---|---|---|---|---|---|---|---|---|---|
| 1993 | 716,457 | 694,156 | 675,482 | 686,152 | 714,526 | 731,702 | 747,122 | 756,403 | 758,996 | 771,501 | 761,896 | 724,754 |
| 1994 | 696,665 | 663,332 | 651,583 | 660,095 | 689,679 | 704,581 | 730,136 | 739,154 | 756,511 | 737,685 | 749,074 | 723,870 |
| 1995 | 721,257 | 686,952 | 669,853 | 673,262 | 687,657 | 689,374 | 717,167 | 714,898 | 722,178 | 703,923 | 693,373 | 667,884 |
| 1996 | 649,542 | 607,388 | 592,990 | 611,968 | 629,812 | 647,608 | 658,696 | 654,651 | 675,688 | 656,150 | 652,635 | 657,747 |
| 1997 | 636,694 | 621,094 | 634,864 | 634,978 | 671,306 | 691,034 | 685,859 | 705,788 | 725,054 | 718,413 | 712,567 | 691,640 |
| 1998 | 689,586 | 687,374 | 689,037 | 699,499 | 737,680 | 754,997 | 760,005 | 776,440 | 779,291 | 755,246 | 767,991 | 752,027 |
| 1999 | 737,942 | 729,784 | 703,170 | 716,159 | 743,960 | 735,784 | 736,084 | 731,597 | 735,855 | 708,719 | 703,065 | 641,208 |
| 2000 | 625,073 | 610,993 | 609,802 | 632,186 | 653,616 | 666,438 | 687,093 | 673,142 | 678,671 | 664,279 | 671,467 | 641,362 |
| 2001 | 642,526 | 648,758 | 633,222 | 648,599 | 683,631 | 711,501 | 711,713 | 696,580 | 724,893 | 718,547 | 728,242 | 724,128 |
| 2002 | 715,746 | 689,117 | 677,832 | 697,048 | 712,658 | 722,132 | 728,026 | 717,868 | 716,190 | 691,941 | 694,500 | 671,205 |
| 2003 | 631,111 | 590,119 | 593,644 | 605,122 | 644,261 | 666,621 | 673,105 | 674,177 | 686,949 | 676,163 | 683,381 | 661,040 |
| 2004 | 643,592 | 625,952 | 621,301 | 618,855 | 644,218 | 663,659 | 686,012 | 706,571 | 698,280 | 680,199 | 695,218 | 683,464 |
| 2005 | 681,082 | 678,379 | 652,770 | 672,213 | 699,626 | 715,210 | 725,968 | 705,644 | 704,289 | 709,014 | 721,387 | 689,356 |
| 2006 | 705,852 | 691,843 | 662,360 | 664,946 | 694,283 | 704,143 | 723,508 | 742,099 | 764,434 | 741,119 | 721,986 | 718,625 |
| 2007 | 710,871 | 660,042 | 658,118 | 662,430 | 680,160 | 685,256 | 706,472 | 704,681 | 712,620 | 706,287 | 694,745 | 682,299 |
| 2008 | 681,994 | 662,510 | 639,708 | 645,206 | 666,200 | 684,282 | 695,642 | 700,870 | 697,973 | 696,562 | 708,635 | 709,076 |
| 2009 | 710,538 | 713,588 | 722,968 | 726,346 | 749,990 | 773,252 | 780,464 | 774,043 | 788,248 | 767,589 | 750,924 | 724,580 |
| 2010 | 718,497 | 711,340 | 698,291 | 716,441 | 738,002 | 744,893 | 767,296 | 772,176 | 767,247 | 749,896 | 745,368 | 730,976 |
| 2011 | 733,959 | 701,366 | 686,694 | 683,725 | 709,036 | 723,239 | 747,975 | 748,908 | 750,064 | 731,148 | 730,738 | 715,406 |
| 2012 | 725,279 | 715,699 | 708,124 | 700,903 | 707,613 | 721,433 | 738,795 | 737,097 | 749,827 | 733,969 | 731,186 | 741,839 |
| 2013 | 732,856 | 703,932 | 698,349 | 709,481 | 724,322 | 740,774 | 749,095 | 755,813 | 758,214 | 725,863 | 713,344 | 701,200 |
| 2014 | 678,584 | 671,160 | 669,728 | 689,910 | 721,041 | 735,730 | 755,656 | 769,199 | 782,304 | 756,585 | 760,300 | 769,952 |
| 2015 | 763,229 | 737,288 | 742,350 | 758,581 | 782,102 | 801,049 | 812,062 | 833,397 | 839,363 | 821,478 | 835,328 | 834,704 |
| 2016 | 843,790 | 827,860 | 820,820 | 826,965 | 839,837 | 850,169 | 875,301 | 882,355 | 881,825 | 862,903 | 865,774 | 845,182 |
| 2017 | 847,157 | 826,448 | 797,995 | 812,165 | 830,163 | 826,529 | 833,345 | 844,908 | 831,361 | 809,909 | 806,280 | 807,524 |
| 2018 | 794,447 | 786,152 | 770,899 | 764,307 | 775,741 | 791,675 | 802,945 | 824,275 | 854,504 | 826,414 | 808,393 | 816,437 |
| 2019 | 816,041 | 796,654 | 786,320 | 793,830 | 825,999 | 840,720 | 867,487 | 870,567 | 872,773 | 842,202 | 837,351 | 849,108 |
| 2020 | 859,640 | 830,150 | 843,381 | 874,564 | 910,645 | 925,046 | 933,864 | 933,179 | 925,457 | 892,407 | 887,972 | 857,877 |
| 2021 | 860,834 | 809,192 | 808,483 | 809,654 | 826,887 | 833,256 | 839,372 | 828,679 | 830,597 | 816,387 | 800,361 | 777,428 |
| 2022 | 776,389 | 757,088 | 740,031 | 736,448 | 757,091 | 762,611 | 791,243 | 792,887 | 786,559 | 790,836 | 810,156 | 792,490 |
| 2023 | 794,635 | 794,337 | 764,755 | 785,955 | 799,401 | 808,361 | 829,985 | 841,257 | 864,562 | 837,640 | 822,146 | 824,927 |
| 2024 | 805,853 | 773,763 | 783,045 | 794,221 | 818,151 | 839,409 | ||||||
| - = No Data Reported; -- = Not Applicable; NA = Not Available; W = Withheld to avoid disclosure of individual company data. |
| Release Date: 8/30/2024 |
| Next Release Date: 9/30/2024 |