|
Download Data (XLS File) |
|
||||||||
|
||||||||
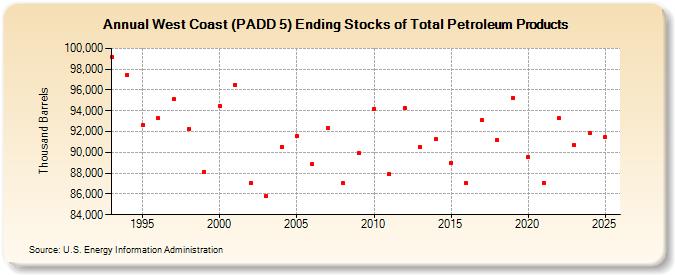
| West Coast (PADD 5) Ending Stocks of Total Petroleum Products (Thousand Barrels) | ||||||||
| Decade | Year-0 | Year-1 | Year-2 | Year-3 | Year-4 | Year-5 | Year-6 | Year-7 | Year-8 | Year-9 |
|---|---|---|---|---|---|---|---|---|---|---|
| 1990's | 99,181 | 97,431 | 92,596 | 93,262 | 95,129 | 92,230 | 88,122 | |||
| 2000's | 94,452 | 96,517 | 87,079 | 85,783 | 90,538 | 91,542 | 88,845 | 92,296 | 87,020 | 89,923 |
| 2010's | 94,206 | 87,895 | 94,239 | 90,541 | 91,253 | 89,008 | 87,040 | 93,132 | 91,148 | 95,233 |
| 2020's | 89,597 | 87,061 | 93,277 | 90,577 |
| - = No Data Reported; -- = Not Applicable; NA = Not Available; W = Withheld to avoid disclosure of individual company data. |
| Release Date: 3/29/2024 |
| Next Release Date: 8/30/2024 |