|
Download Data (XLS File) |
|
||||||||
|
||||||||
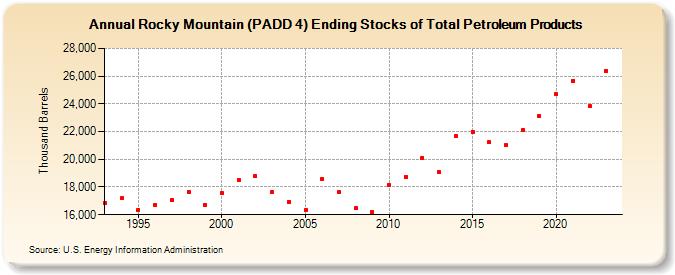
| Rocky Mountain (PADD 4) Ending Stocks of Total Petroleum Products (Thousand Barrels) | ||||||||
| Decade | Year-0 | Year-1 | Year-2 | Year-3 | Year-4 | Year-5 | Year-6 | Year-7 | Year-8 | Year-9 |
|---|---|---|---|---|---|---|---|---|---|---|
| 1990's | 16,841 | 17,185 | 16,353 | 16,705 | 17,079 | 17,657 | 16,724 | |||
| 2000's | 17,550 | 18,514 | 18,801 | 17,616 | 16,947 | 16,323 | 18,610 | 17,648 | 16,463 | 16,229 |
| 2010's | 18,155 | 18,744 | 20,115 | 19,053 | 21,695 | 21,997 | 21,224 | 21,044 | 22,111 | 23,127 |
| 2020's | 24,674 | 25,679 | 23,817 | 26,381 |
| - = No Data Reported; -- = Not Applicable; NA = Not Available; W = Withheld to avoid disclosure of individual company data. |
| Release Date: 3/29/2024 |
| Next Release Date: 8/30/2024 |