|
Download Data (XLS File) |
|
||||||||
|
||||||||
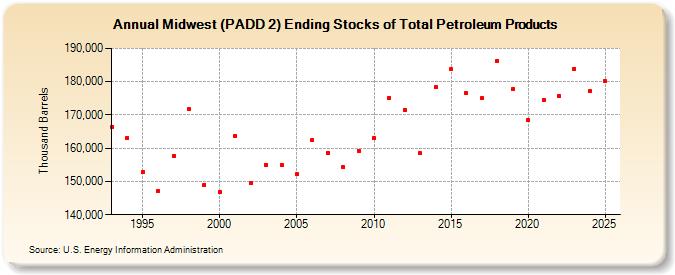
| Midwest (PADD 2) Ending Stocks of Total Petroleum Products (Thousand Barrels) | ||||||||
| Decade | Year-0 | Year-1 | Year-2 | Year-3 | Year-4 | Year-5 | Year-6 | Year-7 | Year-8 | Year-9 |
|---|---|---|---|---|---|---|---|---|---|---|
| 1990's | 166,515 | 163,074 | 152,817 | 147,106 | 157,738 | 171,745 | 149,040 | |||
| 2000's | 146,924 | 163,790 | 149,524 | 155,061 | 154,905 | 152,185 | 162,417 | 158,678 | 154,336 | 159,290 |
| 2010's | 163,126 | 175,207 | 171,458 | 158,435 | 178,321 | 183,669 | 176,567 | 174,979 | 186,299 | 177,685 |
| 2020's | 168,503 | 174,531 | 175,825 | 183,760 |
| - = No Data Reported; -- = Not Applicable; NA = Not Available; W = Withheld to avoid disclosure of individual company data. |
| Release Date: 3/29/2024 |
| Next Release Date: 8/30/2024 |