|
Download Data (XLS File) |
|
||||||||
|
||||||||
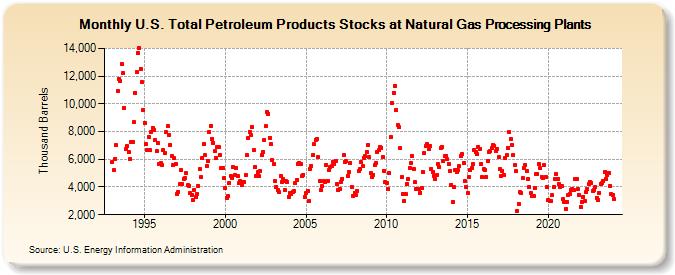
| U.S. Total Petroleum Products Stocks at Natural Gas Processing Plants (Thousand Barrels) | ||||||||
| Year | Jan | Feb | Mar | Apr | May | Jun | Jul | Aug | Sep | Oct | Nov | Dec |
|---|---|---|---|---|---|---|---|---|---|---|---|---|
| 1993 | 5,806 | 5,232 | 6,035 | 6,997 | 10,944 | 11,802 | 11,632 | 12,904 | 12,198 | 9,711 | 6,757 | 6,929 |
| 1994 | 6,491 | 6,008 | 7,235 | 7,218 | 8,657 | 10,814 | 12,306 | 13,694 | 13,995 | 12,539 | 11,560 | 9,537 |
| 1995 | 8,646 | 7,075 | 6,642 | 7,638 | 6,664 | 7,992 | 8,280 | 8,103 | 7,379 | 6,595 | 7,151 | 5,685 |
| 1996 | 5,707 | 5,590 | 6,640 | 6,464 | 7,965 | 8,379 | 7,779 | 7,039 | 6,205 | 5,580 | 6,062 | 5,657 |
| 1997 | 3,496 | 3,658 | 4,190 | 5,194 | 4,244 | 4,607 | 4,662 | 4,990 | 4,112 | 4,067 | 3,554 | 3,428 |
| 1998 | 3,069 | 3,803 | 3,251 | 3,530 | 4,080 | 5,298 | 4,718 | 6,057 | 7,084 | 6,290 | 5,549 | 5,873 |
| 1999 | 7,950 | 8,407 | 7,463 | 7,200 | 6,576 | 6,118 | 6,853 | 6,883 | 6,333 | 5,374 | 5,353 | 4,647 |
| 2000 | 3,939 | 3,222 | 3,350 | 4,300 | 4,792 | 4,666 | 5,430 | 4,834 | 5,390 | 4,792 | 4,264 | 4,437 |
| 2001 | 4,128 | 4,360 | 4,338 | 4,879 | 6,275 | 7,516 | 7,993 | 7,716 | 8,334 | 6,653 | 5,473 | 4,790 |
| 2002 | 5,055 | 4,764 | 5,137 | 6,273 | 6,542 | 7,404 | 8,374 | 9,413 | 9,301 | 7,553 | 7,093 | 5,920 |
| 2003 | 5,654 | 4,397 | 4,011 | 3,816 | 3,631 | 4,804 | 4,376 | 4,569 | 3,793 | 4,406 | 4,351 | 3,305 |
| 2004 | 3,592 | 3,493 | 3,674 | 3,696 | 4,264 | 4,519 | 5,695 | 5,757 | 5,632 | 4,781 | 4,890 | 3,286 |
| 2005 | 3,567 | 3,712 | 2,971 | 5,328 | 5,522 | 6,280 | 7,073 | 7,422 | 7,469 | 6,160 | 4,410 | 3,786 |
| 2006 | 4,054 | 4,427 | 4,380 | 5,578 | 4,460 | 5,213 | 5,408 | 5,494 | 5,828 | 5,688 | 5,852 | 4,214 |
| 2007 | 3,749 | 3,846 | 4,384 | 4,610 | 6,326 | 5,826 | 5,864 | 4,819 | 5,096 | 5,731 | 3,996 | 3,382 |
| 2008 | 3,592 | 3,429 | 3,732 | 5,167 | 5,292 | 5,776 | 5,488 | 6,110 | 6,234 | 6,558 | 7,051 | 6,154 |
| 2009 | 4,992 | 4,708 | 4,893 | 5,575 | 5,732 | 6,529 | 6,639 | 6,919 | 6,845 | 6,156 | 5,172 | 4,387 |
| 2010 | 4,307 | 3,847 | 5,004 | 7,621 | 10,074 | 10,806 | 11,319 | 9,584 | 8,487 | 8,298 | 6,779 | 4,738 |
| 2011 | 3,475 | 2,988 | 3,469 | 4,217 | 4,601 | 5,388 | 5,737 | 6,226 | 5,301 | 4,338 | 3,841 | 3,841 |
| 2012 | 3,889 | 3,594 | 3,907 | 5,086 | 6,430 | 6,942 | 7,083 | 6,730 | 6,928 | 5,324 | 5,050 | 4,828 |
| 2013 | 4,550 | 4,838 | 5,663 | 5,456 | 6,781 | 6,906 | 5,840 | 6,232 | 6,271 | 5,999 | 5,691 | 5,118 |
| 2014 | 4,178 | 2,941 | 3,969 | 5,202 | 5,095 | 5,218 | 5,485 | 6,260 | 6,392 | 5,760 | 4,418 | 4,005 |
| 2015 | 3,536 | 4,723 | 5,201 | 5,353 | 5,638 | 6,682 | 6,517 | 6,367 | 6,903 | 6,767 | 5,684 | 4,685 |
| 2016 | 5,276 | 5,233 | 4,735 | 5,909 | 6,518 | 6,564 | 6,778 | 7,028 | 6,968 | 6,576 | 6,759 | 6,136 |
| 2017 | 5,271 | 4,806 | 5,158 | 4,877 | 6,117 | 6,287 | 6,846 | 7,932 | 7,468 | 7,035 | 6,291 | 5,552 |
| 2018 | 5,124 | 2,278 | 2,777 | 3,634 | 3,560 | 4,629 | 5,360 | 5,585 | 5,185 | 4,571 | 4,031 | 3,555 |
| 2019 | 3,375 | 3,354 | 3,903 | 4,902 | 4,956 | 5,666 | 5,335 | 4,741 | 4,615 | 5,572 | 4,733 | 3,975 |
| 2020 | 3,070 | 3,011 | 2,975 | 3,393 | 3,978 | 4,605 | 4,902 | 4,603 | 4,209 | 4,019 | 4,088 | 3,103 |
| 2021 | 2,942 | 2,420 | 2,925 | 3,452 | 3,525 | 3,761 | 3,838 | 3,782 | 4,600 | 4,594 | 3,856 | 3,410 |
| 2022 | 2,592 | 2,919 | 3,307 | 2,958 | 3,646 | 3,841 | 4,229 | 4,396 | 4,298 | 3,698 | 3,776 | 3,985 |
| 2023 | 3,232 | 3,085 | 3,594 | 4,203 | 4,288 | 4,426 | 5,088 | 4,578 | 4,852 | 5,031 | 4,091 | 3,467 |
| 2024 | 3,420 | |||||||||||
| - = No Data Reported; -- = Not Applicable; NA = Not Available; W = Withheld to avoid disclosure of individual company data. |
| Release Date: 3/29/2024 |
| Next Release Date: 4/30/2024 |