|
Download Data (XLS File) |
|
|||||
|
|||||
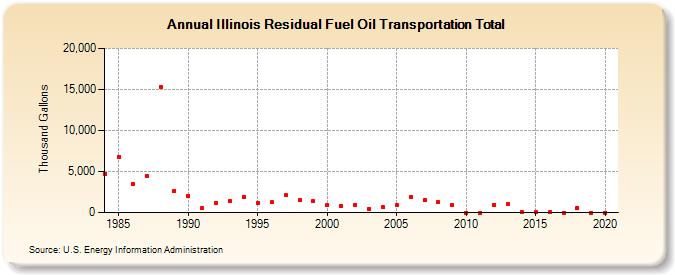
| Illinois Residual Fuel Oil Transportation Total (Thousand Gallons) | |||||
| Decade | Year-0 | Year-1 | Year-2 | Year-3 | Year-4 | Year-5 | Year-6 | Year-7 | Year-8 | Year-9 |
|---|---|---|---|---|---|---|---|---|---|---|
| 1980's | 4,745 | 6,816 | 3,473 | 4,461 | 15,351 | 2,671 | ||||
| 1990's | 2,034 | 563 | 1,221 | 1,376 | 1,939 | 1,143 | 1,263 | 2,106 | 1,473 | 1,372 |
| 2000's | 868 | 813 | 965 | 477 | 635 | 902 | 1,868 | 1,486 | 1,230 | 881 |
| 2010's | 0 | 0 | 972 | 987 | 71 | 75 | 29 | 0 | 582 | 0 |
| 2020's | 0 |
| - = No Data Reported; -- = Not Applicable; NA = Not Available; W = Withheld to avoid disclosure of individual company data. |
| Release Date: 2/9/2022 |
| Next Release Date: Suspended |