|
Download Data (XLS File) |
|
|||||
|
|||||
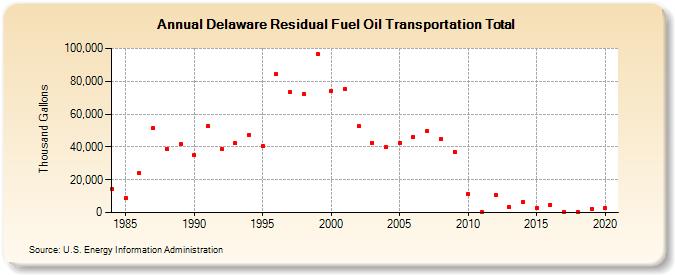
| Delaware Residual Fuel Oil Transportation Total (Thousand Gallons) | |||||
| Decade | Year-0 | Year-1 | Year-2 | Year-3 | Year-4 | Year-5 | Year-6 | Year-7 | Year-8 | Year-9 |
|---|---|---|---|---|---|---|---|---|---|---|
| 1980's | 14,426 | 8,765 | 23,966 | 51,330 | 38,735 | 41,561 | ||||
| 1990's | 34,870 | 52,719 | 38,427 | 42,148 | 47,463 | 40,462 | 84,114 | 73,277 | 72,240 | 96,415 |
| 2000's | 74,076 | 75,287 | 52,593 | 42,545 | 39,650 | 42,616 | 46,032 | 49,908 | 44,680 | 37,063 |
| 2010's | 11,340 | 197 | 10,544 | 3,680 | 6,314 | 2,953 | 4,637 | 612 | 523 | 2,336 |
| 2020's | 2,767 |
| - = No Data Reported; -- = Not Applicable; NA = Not Available; W = Withheld to avoid disclosure of individual company data. |
| Release Date: 2/9/2022 |
| Next Release Date: Suspended |