|
Download Data (XLS File) |
|
|||||
|
|||||
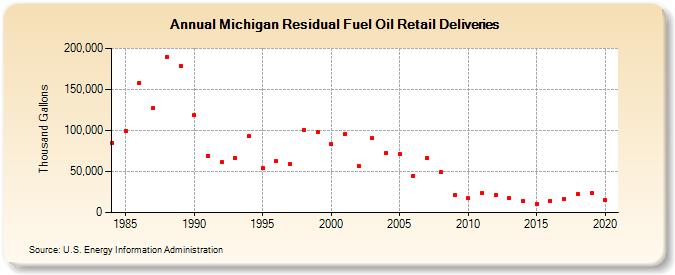
| Michigan Residual Fuel Oil Retail Deliveries (Thousand Gallons) | |||||
| Decade | Year-0 | Year-1 | Year-2 | Year-3 | Year-4 | Year-5 | Year-6 | Year-7 | Year-8 | Year-9 |
|---|---|---|---|---|---|---|---|---|---|---|
| 1980's | 85,219 | 99,547 | 158,266 | 126,984 | 189,307 | 178,943 | ||||
| 1990's | 118,260 | 69,172 | 61,025 | 66,166 | 92,884 | 53,911 | 62,847 | 59,403 | 100,113 | 98,073 |
| 2000's | 83,007 | 96,277 | 56,854 | 90,432 | 72,535 | 71,545 | 44,956 | 66,975 | 49,294 | 20,787 |
| 2010's | 17,283 | 23,869 | 20,855 | 17,264 | 13,983 | 10,707 | 14,309 | 16,991 | 22,790 | 23,732 |
| 2020's | 15,248 |
| - = No Data Reported; -- = Not Applicable; NA = Not Available; W = Withheld to avoid disclosure of individual company data. |
| Release Date: 2/9/2022 |
| Next Release Date: Suspended |