|
Download Data (XLS File) |
|
|||||
|
|||||
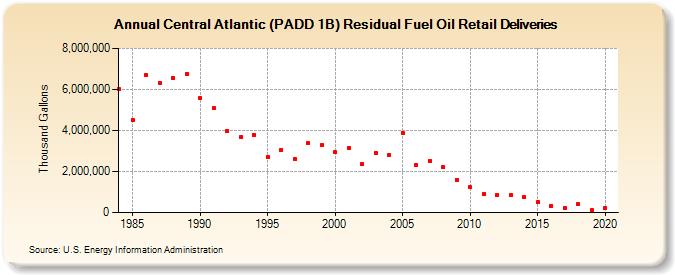
| Central Atlantic (PADD 1B) Residual Fuel Oil Retail Deliveries (Thousand Gallons) | |||||
| Decade | Year-0 | Year-1 | Year-2 | Year-3 | Year-4 | Year-5 | Year-6 | Year-7 | Year-8 | Year-9 |
|---|---|---|---|---|---|---|---|---|---|---|
| 1980's | 6,008,068 | 4,512,167 | 6,713,578 | 6,316,795 | 6,577,171 | 6,769,789 | ||||
| 1990's | 5,601,354 | 5,080,423 | 3,983,410 | 3,681,592 | 3,802,602 | 2,708,752 | 3,061,228 | 2,607,954 | 3,372,783 | 3,300,534 |
| 2000's | 2,928,153 | 3,165,215 | 2,357,633 | 2,915,477 | 2,826,604 | 3,876,920 | 2,316,326 | 2,528,915 | 2,207,156 | 1,604,840 |
| 2010's | 1,229,789 | 894,944 | 877,751 | 842,385 | 756,633 | 505,187 | 324,008 | 224,967 | 400,001 | 124,593 |
| 2020's | 215,247 |
| - = No Data Reported; -- = Not Applicable; NA = Not Available; W = Withheld to avoid disclosure of individual company data. |
| Release Date: 2/9/2022 |
| Next Release Date: Suspended |