|
Download Data (XLS File) |
|
|||||
|
|||||
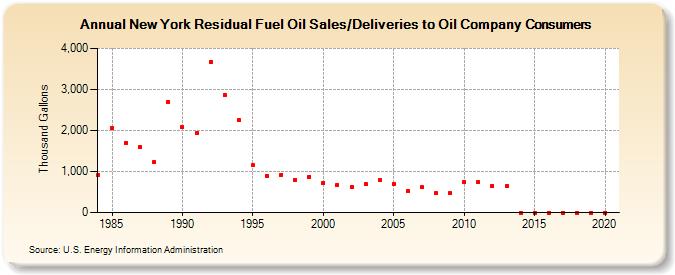
| New York Residual Fuel Oil Sales/Deliveries to Oil Company Consumers (Thousand Gallons) | |||||
| Decade | Year-0 | Year-1 | Year-2 | Year-3 | Year-4 | Year-5 | Year-6 | Year-7 | Year-8 | Year-9 |
|---|---|---|---|---|---|---|---|---|---|---|
| 1980's | 915 | 2,060 | 1,698 | 1,601 | 1,233 | 2,694 | ||||
| 1990's | 2,084 | 1,938 | 3,674 | 2,870 | 2,253 | 1,147 | 893 | 920 | 798 | 876 |
| 2000's | 722 | 678 | 620 | 695 | 785 | 698 | 519 | 614 | 467 | 477 |
| 2010's | 748 | 742 | 656 | 642 | 0 | 0 | 0 | 0 | 0 | 0 |
| 2020's | 0 |
| - = No Data Reported; -- = Not Applicable; NA = Not Available; W = Withheld to avoid disclosure of individual company data. |
| Release Date: 2/9/2022 |
| Next Release Date: Suspended |