|
Download Data (XLS File) |
|
|||||
|
|||||
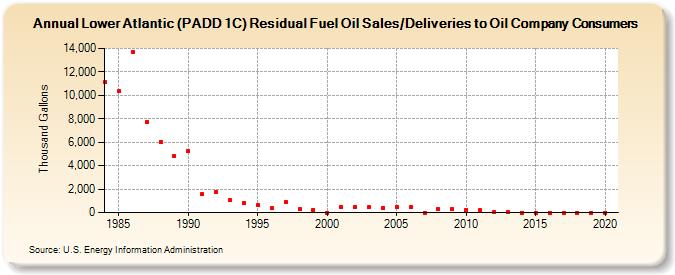
| Lower Atlantic (PADD 1C) Residual Fuel Oil Sales/Deliveries to Oil Company Consumers (Thousand Gallons) | |||||
| Decade | Year-0 | Year-1 | Year-2 | Year-3 | Year-4 | Year-5 | Year-6 | Year-7 | Year-8 | Year-9 |
|---|---|---|---|---|---|---|---|---|---|---|
| 1980's | 11,114 | 10,336 | 13,702 | 7,712 | 6,034 | 4,786 | ||||
| 1990's | 5,258 | 1,544 | 1,763 | 1,065 | 816 | 631 | 384 | 923 | 277 | 253 |
| 2000's | 0 | 456 | 498 | 443 | 406 | 456 | 439 | 0 | 303 | 296 |
| 2010's | 252 | 217 | 89 | 11 | 0 | 0 | 0 | 0 | 0 | 0 |
| 2020's | 0 |
| - = No Data Reported; -- = Not Applicable; NA = Not Available; W = Withheld to avoid disclosure of individual company data. |
| Release Date: 2/9/2022 |
| Next Release Date: Suspended |