|
Download Data (XLS File) |
|
|||||
|
|||||
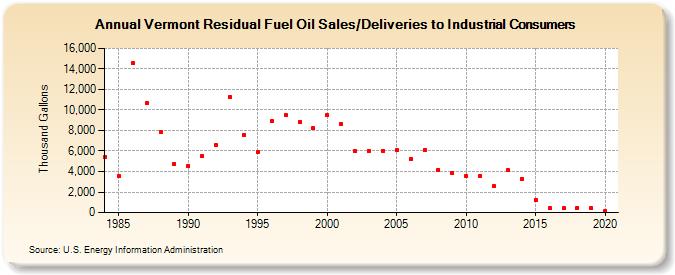
| Vermont Residual Fuel Oil Sales/Deliveries to Industrial Consumers (Thousand Gallons) | |||||
| Decade | Year-0 | Year-1 | Year-2 | Year-3 | Year-4 | Year-5 | Year-6 | Year-7 | Year-8 | Year-9 |
|---|---|---|---|---|---|---|---|---|---|---|
| 1980's | 5,403 | 3,534 | 14,533 | 10,653 | 7,848 | 4,769 | ||||
| 1990's | 4,568 | 5,507 | 6,550 | 11,288 | 7,596 | 5,912 | 8,919 | 9,480 | 8,848 | 8,204 |
| 2000's | 9,461 | 8,672 | 5,963 | 6,021 | 6,044 | 6,082 | 5,223 | 6,077 | 4,190 | 3,809 |
| 2010's | 3,534 | 3,575 | 2,557 | 4,111 | 3,297 | 1,233 | 406 | 397 | 486 | 427 |
| 2020's | 155 |
| - = No Data Reported; -- = Not Applicable; NA = Not Available; W = Withheld to avoid disclosure of individual company data. |
| Release Date: 2/9/2022 |
| Next Release Date: Suspended |