|
Download Data (XLS File) |
|
|||||
|
|||||
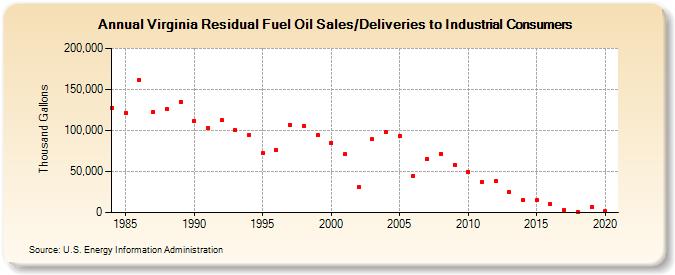
| Virginia Residual Fuel Oil Sales/Deliveries to Industrial Consumers (Thousand Gallons) | |||||
| Decade | Year-0 | Year-1 | Year-2 | Year-3 | Year-4 | Year-5 | Year-6 | Year-7 | Year-8 | Year-9 |
|---|---|---|---|---|---|---|---|---|---|---|
| 1980's | 127,383 | 121,535 | 162,041 | 122,506 | 125,939 | 135,027 | ||||
| 1990's | 111,721 | 102,994 | 112,687 | 100,423 | 94,939 | 71,957 | 75,935 | 107,244 | 105,993 | 94,248 |
| 2000's | 85,128 | 70,916 | 30,650 | 89,236 | 97,974 | 93,832 | 44,848 | 65,477 | 71,424 | 57,906 |
| 2010's | 49,850 | 37,668 | 38,582 | 25,260 | 14,806 | 14,853 | 10,316 | 2,556 | 1,128 | 6,591 |
| 2020's | 1,330 |
| - = No Data Reported; -- = Not Applicable; NA = Not Available; W = Withheld to avoid disclosure of individual company data. |
| Release Date: 2/9/2022 |
| Next Release Date: Suspended |