|
Download Data (XLS File) |
|
|||||
|
|||||
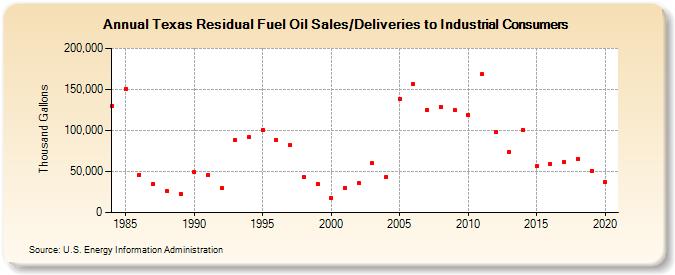
| Texas Residual Fuel Oil Sales/Deliveries to Industrial Consumers (Thousand Gallons) | |||||
| Decade | Year-0 | Year-1 | Year-2 | Year-3 | Year-4 | Year-5 | Year-6 | Year-7 | Year-8 | Year-9 |
|---|---|---|---|---|---|---|---|---|---|---|
| 1980's | 129,832 | 150,859 | 46,181 | 34,810 | 25,998 | 23,012 | ||||
| 1990's | 49,521 | 45,512 | 29,670 | 88,148 | 91,995 | 100,619 | 88,946 | 82,449 | 43,339 | 35,153 |
| 2000's | 18,305 | 30,209 | 35,512 | 60,223 | 43,229 | 138,296 | 156,974 | 125,281 | 129,003 | 124,762 |
| 2010's | 119,126 | 168,467 | 97,886 | 74,236 | 100,793 | 56,565 | 59,340 | 61,395 | 65,659 | 51,023 |
| 2020's | 37,039 |
| - = No Data Reported; -- = Not Applicable; NA = Not Available; W = Withheld to avoid disclosure of individual company data. |
| Release Date: 2/9/2022 |
| Next Release Date: Suspended |