|
Download Data (XLS File) |
|
|||||
|
|||||
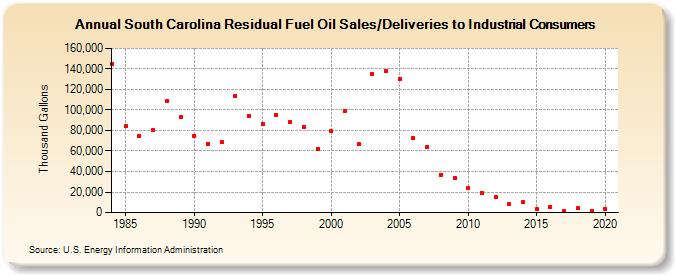
| South Carolina Residual Fuel Oil Sales/Deliveries to Industrial Consumers (Thousand Gallons) | |||||
| Decade | Year-0 | Year-1 | Year-2 | Year-3 | Year-4 | Year-5 | Year-6 | Year-7 | Year-8 | Year-9 |
|---|---|---|---|---|---|---|---|---|---|---|
| 1980's | 144,839 | 84,007 | 74,658 | 80,153 | 108,659 | 93,020 | ||||
| 1990's | 74,984 | 67,284 | 69,153 | 113,612 | 93,635 | 86,324 | 95,334 | 87,974 | 83,726 | 61,951 |
| 2000's | 79,096 | 99,018 | 66,418 | 135,356 | 137,657 | 129,984 | 73,055 | 64,368 | 36,874 | 33,567 |
| 2010's | 24,140 | 19,340 | 14,819 | 7,982 | 9,909 | 3,011 | 5,342 | 1,237 | 4,070 | 1,494 |
| 2020's | 3,594 |
| - = No Data Reported; -- = Not Applicable; NA = Not Available; W = Withheld to avoid disclosure of individual company data. |
| Release Date: 2/9/2022 |
| Next Release Date: Suspended |