|
Download Data (XLS File) |
|
|||||
|
|||||
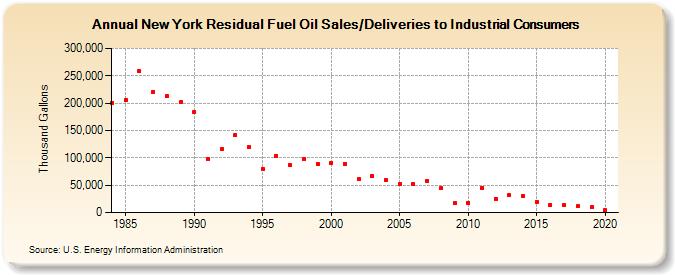
| New York Residual Fuel Oil Sales/Deliveries to Industrial Consumers (Thousand Gallons) | |||||
| Decade | Year-0 | Year-1 | Year-2 | Year-3 | Year-4 | Year-5 | Year-6 | Year-7 | Year-8 | Year-9 |
|---|---|---|---|---|---|---|---|---|---|---|
| 1980's | 201,024 | 205,935 | 258,191 | 220,412 | 212,668 | 201,398 | ||||
| 1990's | 184,236 | 98,142 | 115,993 | 141,259 | 120,288 | 80,419 | 103,534 | 86,772 | 97,759 | 89,040 |
| 2000's | 90,733 | 89,324 | 60,767 | 67,043 | 58,721 | 51,384 | 51,560 | 58,026 | 44,116 | 17,254 |
| 2010's | 17,931 | 45,345 | 25,526 | 31,833 | 29,906 | 19,629 | 13,500 | 13,157 | 11,346 | 9,368 |
| 2020's | 4,544 |
| - = No Data Reported; -- = Not Applicable; NA = Not Available; W = Withheld to avoid disclosure of individual company data. |
| Release Date: 2/9/2022 |
| Next Release Date: Suspended |