|
Download Data (XLS File) |
|
|||||
|
|||||
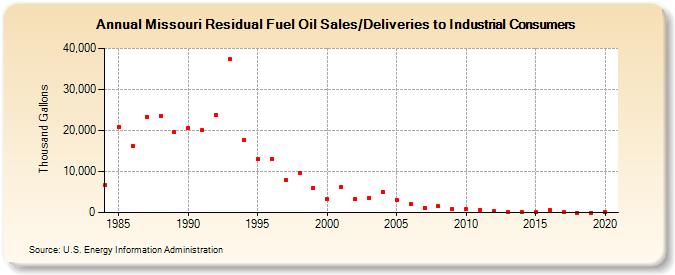
| Missouri Residual Fuel Oil Sales/Deliveries to Industrial Consumers (Thousand Gallons) | |||||
| Decade | Year-0 | Year-1 | Year-2 | Year-3 | Year-4 | Year-5 | Year-6 | Year-7 | Year-8 | Year-9 |
|---|---|---|---|---|---|---|---|---|---|---|
| 1980's | 6,688 | 20,911 | 16,232 | 23,357 | 23,536 | 19,641 | ||||
| 1990's | 20,652 | 19,996 | 23,669 | 37,412 | 17,779 | 13,085 | 13,120 | 8,014 | 9,619 | 6,044 |
| 2000's | 3,280 | 6,272 | 3,189 | 3,573 | 5,072 | 3,093 | 2,048 | 1,182 | 1,499 | 923 |
| 2010's | 846 | 696 | 277 | 183 | 121 | 87 | 513 | 68 | 11 | 0 |
| 2020's | 110 |
| - = No Data Reported; -- = Not Applicable; NA = Not Available; W = Withheld to avoid disclosure of individual company data. |
| Release Date: 2/9/2022 |
| Next Release Date: Suspended |