|
Download Data (XLS File) |
|
|||||
|
|||||
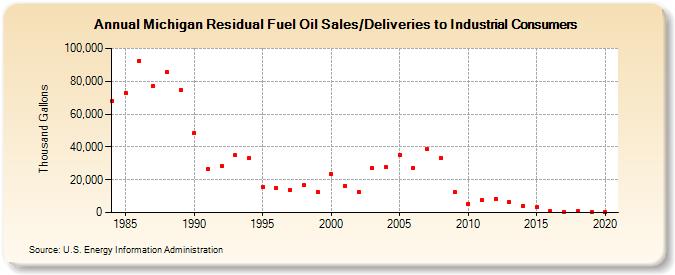
| Michigan Residual Fuel Oil Sales/Deliveries to Industrial Consumers (Thousand Gallons) | |||||
| Decade | Year-0 | Year-1 | Year-2 | Year-3 | Year-4 | Year-5 | Year-6 | Year-7 | Year-8 | Year-9 |
|---|---|---|---|---|---|---|---|---|---|---|
| 1980's | 68,205 | 72,824 | 92,616 | 77,285 | 85,576 | 74,584 | ||||
| 1990's | 48,579 | 26,501 | 28,432 | 34,859 | 33,181 | 15,472 | 15,022 | 13,974 | 16,556 | 12,788 |
| 2000's | 23,510 | 16,400 | 12,635 | 27,203 | 27,553 | 34,945 | 27,332 | 38,415 | 33,297 | 12,514 |
| 2010's | 5,400 | 7,923 | 8,534 | 6,284 | 3,964 | 3,273 | 755 | 445 | 739 | 628 |
| 2020's | 615 |
| - = No Data Reported; -- = Not Applicable; NA = Not Available; W = Withheld to avoid disclosure of individual company data. |
| Release Date: 2/9/2022 |
| Next Release Date: Suspended |