|
Download Data (XLS File) |
|
|||||
|
|||||
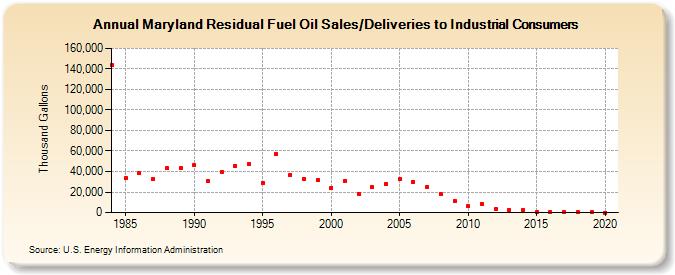
| Maryland Residual Fuel Oil Sales/Deliveries to Industrial Consumers (Thousand Gallons) | |||||
| Decade | Year-0 | Year-1 | Year-2 | Year-3 | Year-4 | Year-5 | Year-6 | Year-7 | Year-8 | Year-9 |
|---|---|---|---|---|---|---|---|---|---|---|
| 1980's | 143,843 | 33,612 | 38,776 | 32,861 | 43,122 | 43,144 | ||||
| 1990's | 46,065 | 30,329 | 39,622 | 45,187 | 47,169 | 29,235 | 57,229 | 36,768 | 32,872 | 32,053 |
| 2000's | 24,311 | 30,774 | 18,006 | 24,705 | 28,187 | 32,352 | 29,542 | 25,380 | 17,808 | 11,352 |
| 2010's | 6,085 | 8,774 | 3,254 | 2,561 | 2,078 | 762 | 613 | 354 | 182 | 145 |
| 2020's | 0 |
| - = No Data Reported; -- = Not Applicable; NA = Not Available; W = Withheld to avoid disclosure of individual company data. |
| Release Date: 2/9/2022 |
| Next Release Date: Suspended |