|
Download Data (XLS File) |
|
|||||
|
|||||
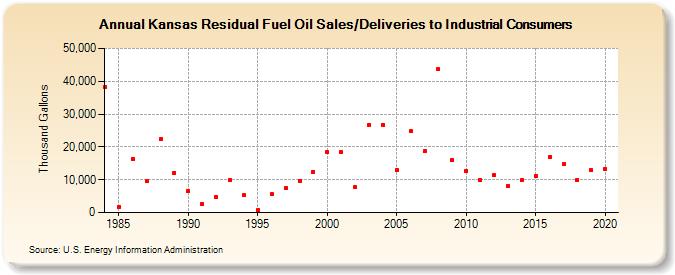
| Kansas Residual Fuel Oil Sales/Deliveries to Industrial Consumers (Thousand Gallons) | |||||
| Decade | Year-0 | Year-1 | Year-2 | Year-3 | Year-4 | Year-5 | Year-6 | Year-7 | Year-8 | Year-9 |
|---|---|---|---|---|---|---|---|---|---|---|
| 1980's | 38,263 | 1,834 | 16,266 | 9,595 | 22,289 | 12,078 | ||||
| 1990's | 6,568 | 2,674 | 4,657 | 9,935 | 5,259 | 752 | 5,637 | 7,477 | 9,700 | 12,369 |
| 2000's | 18,297 | 18,428 | 7,762 | 26,695 | 26,755 | 13,007 | 24,777 | 18,637 | 43,618 | 15,987 |
| 2010's | 12,808 | 9,928 | 11,312 | 8,021 | 9,770 | 11,082 | 16,980 | 14,651 | 10,008 | 12,930 |
| 2020's | 13,306 |
| - = No Data Reported; -- = Not Applicable; NA = Not Available; W = Withheld to avoid disclosure of individual company data. |
| Release Date: 2/9/2022 |
| Next Release Date: Suspended |