|
Download Data (XLS File) |
|
|||||
|
|||||
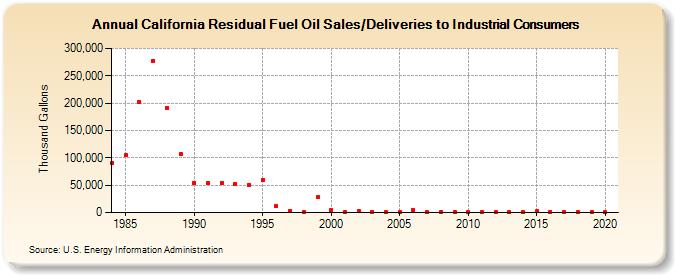
| California Residual Fuel Oil Sales/Deliveries to Industrial Consumers (Thousand Gallons) | |||||
| Decade | Year-0 | Year-1 | Year-2 | Year-3 | Year-4 | Year-5 | Year-6 | Year-7 | Year-8 | Year-9 |
|---|---|---|---|---|---|---|---|---|---|---|
| 1980's | 90,486 | 105,356 | 202,374 | 277,768 | 191,576 | 106,945 | ||||
| 1990's | 53,957 | 53,936 | 53,753 | 51,898 | 51,250 | 59,985 | 11,478 | 3,611 | 1,597 | 27,582 |
| 2000's | 4,914 | 934 | 2,177 | 1,536 | 560 | 435 | 4,064 | 422 | 1,597 | 235 |
| 2010's | 371 | 262 | 247 | 278 | 281 | 2,099 | 1,694 | 460 | 287 | 281 |
| 2020's | 222 |
| - = No Data Reported; -- = Not Applicable; NA = Not Available; W = Withheld to avoid disclosure of individual company data. |
| Release Date: 2/9/2022 |
| Next Release Date: Suspended |