|
Download Data (XLS File) |
|
|||||
|
|||||
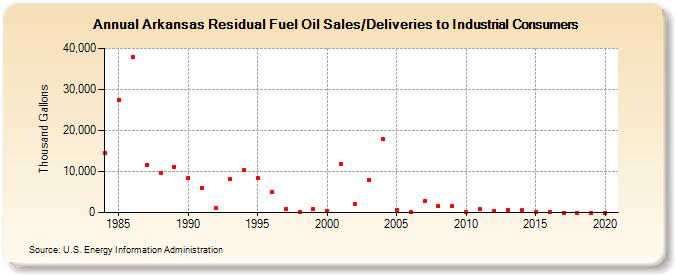
| Arkansas Residual Fuel Oil Sales/Deliveries to Industrial Consumers (Thousand Gallons) | |||||
| Decade | Year-0 | Year-1 | Year-2 | Year-3 | Year-4 | Year-5 | Year-6 | Year-7 | Year-8 | Year-9 |
|---|---|---|---|---|---|---|---|---|---|---|
| 1980's | 14,628 | 27,398 | 37,886 | 11,584 | 9,731 | 11,106 | ||||
| 1990's | 8,504 | 6,090 | 1,039 | 8,057 | 10,285 | 8,362 | 4,915 | 931 | 177 | 924 |
| 2000's | 405 | 11,815 | 2,090 | 8,039 | 17,887 | 743 | 175 | 2,770 | 1,591 | 1,485 |
| 2010's | 26 | 817 | 485 | 573 | 548 | 59 | 30 | 0 | 0 | 0 |
| 2020's | 0 |
| - = No Data Reported; -- = Not Applicable; NA = Not Available; W = Withheld to avoid disclosure of individual company data. |
| Release Date: 2/9/2022 |
| Next Release Date: Suspended |