|
Download Data (XLS File) |
|
|||||
|
|||||
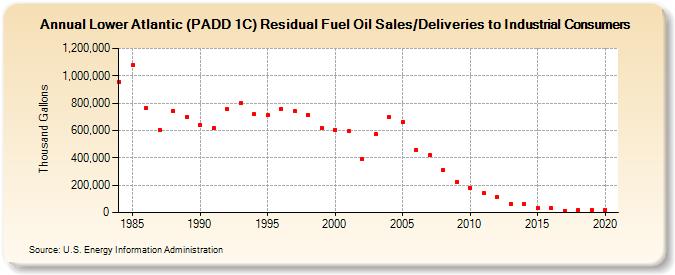
| Lower Atlantic (PADD 1C) Residual Fuel Oil Sales/Deliveries to Industrial Consumers (Thousand Gallons) | |||||
| Decade | Year-0 | Year-1 | Year-2 | Year-3 | Year-4 | Year-5 | Year-6 | Year-7 | Year-8 | Year-9 |
|---|---|---|---|---|---|---|---|---|---|---|
| 1980's | 956,411 | 1,078,262 | 766,060 | 604,003 | 743,102 | 700,220 | ||||
| 1990's | 642,555 | 616,278 | 755,082 | 799,999 | 717,746 | 710,998 | 758,140 | 739,662 | 716,409 | 620,582 |
| 2000's | 605,442 | 593,435 | 392,800 | 571,818 | 696,601 | 662,506 | 459,756 | 420,373 | 311,631 | 223,493 |
| 2010's | 182,006 | 141,606 | 113,162 | 64,814 | 60,717 | 35,364 | 34,092 | 13,672 | 18,404 | 20,815 |
| 2020's | 20,741 |
| - = No Data Reported; -- = Not Applicable; NA = Not Available; W = Withheld to avoid disclosure of individual company data. |
| Release Date: 2/9/2022 |
| Next Release Date: Suspended |