|
Download Data (XLS File) |
|
|||||
|
|||||
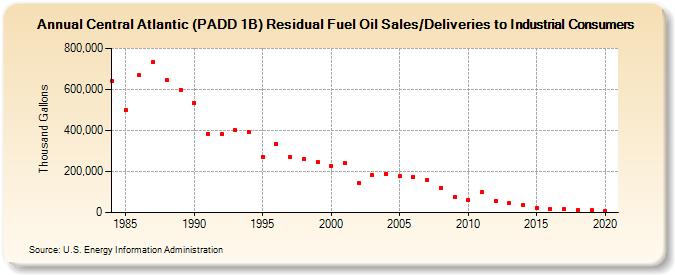
| Central Atlantic (PADD 1B) Residual Fuel Oil Sales/Deliveries to Industrial Consumers (Thousand Gallons) | |||||
| Decade | Year-0 | Year-1 | Year-2 | Year-3 | Year-4 | Year-5 | Year-6 | Year-7 | Year-8 | Year-9 |
|---|---|---|---|---|---|---|---|---|---|---|
| 1980's | 640,118 | 498,090 | 668,093 | 733,085 | 645,941 | 598,962 | ||||
| 1990's | 533,275 | 385,041 | 381,492 | 400,168 | 392,483 | 271,859 | 334,383 | 271,866 | 261,037 | 247,203 |
| 2000's | 226,604 | 240,402 | 145,183 | 181,283 | 189,255 | 176,101 | 173,749 | 157,892 | 121,988 | 73,489 |
| 2010's | 62,767 | 99,644 | 57,119 | 48,923 | 36,459 | 24,512 | 17,743 | 15,861 | 13,648 | 11,915 |
| 2020's | 7,168 |
| - = No Data Reported; -- = Not Applicable; NA = Not Available; W = Withheld to avoid disclosure of individual company data. |
| Release Date: 2/9/2022 |
| Next Release Date: Suspended |