|
Download Data (XLS File) |
|
|||||
|
|||||
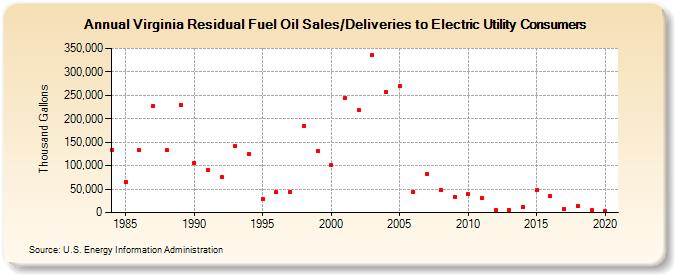
| Virginia Residual Fuel Oil Sales/Deliveries to Electric Utility Consumers (Thousand Gallons) | |||||
| Decade | Year-0 | Year-1 | Year-2 | Year-3 | Year-4 | Year-5 | Year-6 | Year-7 | Year-8 | Year-9 |
|---|---|---|---|---|---|---|---|---|---|---|
| 1980's | 133,344 | 65,908 | 132,435 | 226,841 | 132,653 | 230,180 | ||||
| 1990's | 106,721 | 90,901 | 74,762 | 140,866 | 125,035 | 28,821 | 43,041 | 44,492 | 185,235 | 131,448 |
| 2000's | 100,564 | 244,062 | 219,312 | 334,885 | 256,522 | 269,666 | 44,101 | 81,625 | 48,611 | 32,798 |
| 2010's | 39,387 | 32,050 | 5,237 | 5,751 | 11,819 | 47,147 | 34,541 | 7,554 | 14,950 | 4,903 |
| 2020's | 2,450 |
| - = No Data Reported; -- = Not Applicable; NA = Not Available; W = Withheld to avoid disclosure of individual company data. |
| Release Date: 2/9/2022 |
| Next Release Date: Suspended |