|
Download Data (XLS File) |
|
|||||
|
|||||
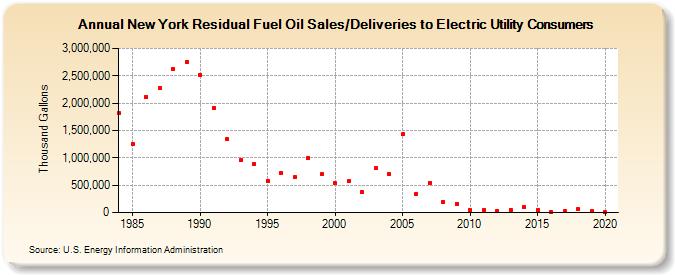
| New York Residual Fuel Oil Sales/Deliveries to Electric Utility Consumers (Thousand Gallons) | |||||
| Decade | Year-0 | Year-1 | Year-2 | Year-3 | Year-4 | Year-5 | Year-6 | Year-7 | Year-8 | Year-9 |
|---|---|---|---|---|---|---|---|---|---|---|
| 1980's | 1,815,841 | 1,257,272 | 2,120,342 | 2,273,277 | 2,621,013 | 2,751,059 | ||||
| 1990's | 2,522,590 | 1,911,519 | 1,342,151 | 958,225 | 893,326 | 584,682 | 718,952 | 643,544 | 999,720 | 695,779 |
| 2000's | 532,620 | 568,147 | 379,756 | 808,354 | 699,915 | 1,427,183 | 339,440 | 545,808 | 192,451 | 157,203 |
| 2010's | 46,306 | 42,580 | 29,891 | 45,174 | 103,794 | 51,228 | 13,962 | 23,100 | 59,317 | 22,049 |
| 2020's | 5,580 |
| - = No Data Reported; -- = Not Applicable; NA = Not Available; W = Withheld to avoid disclosure of individual company data. |
| Release Date: 2/9/2022 |
| Next Release Date: Suspended |