|
Download Data (XLS File) |
|
|||||
|
|||||
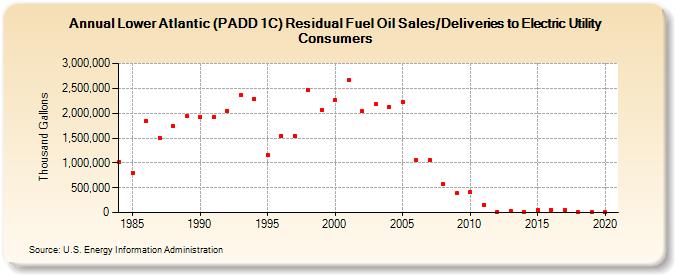
| Lower Atlantic (PADD 1C) Residual Fuel Oil Sales/Deliveries to Electric Utility Consumers (Thousand Gallons) | |||||
| Decade | Year-0 | Year-1 | Year-2 | Year-3 | Year-4 | Year-5 | Year-6 | Year-7 | Year-8 | Year-9 |
|---|---|---|---|---|---|---|---|---|---|---|
| 1980's | 1,013,651 | 801,788 | 1,844,289 | 1,502,956 | 1,733,289 | 1,937,047 | ||||
| 1990's | 1,927,568 | 1,932,081 | 2,049,318 | 2,361,019 | 2,293,814 | 1,157,438 | 1,549,590 | 1,546,839 | 2,456,416 | 2,071,726 |
| 2000's | 2,264,500 | 2,663,709 | 2,035,241 | 2,177,619 | 2,131,168 | 2,234,341 | 1,066,671 | 1,059,892 | 569,333 | 386,169 |
| 2010's | 405,655 | 161,737 | 16,334 | 27,014 | 18,264 | 56,282 | 58,037 | 44,710 | 14,950 | 4,903 |
| 2020's | 2,450 |
| - = No Data Reported; -- = Not Applicable; NA = Not Available; W = Withheld to avoid disclosure of individual company data. |
| Release Date: 2/9/2022 |
| Next Release Date: Suspended |