|
Download Data (XLS File) |
|
|||||
|
|||||
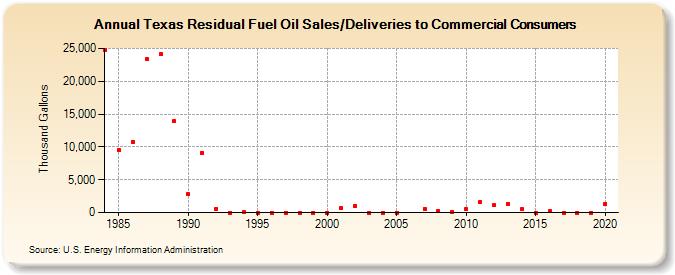
| Texas Residual Fuel Oil Sales/Deliveries to Commercial Consumers (Thousand Gallons) | |||||
| Decade | Year-0 | Year-1 | Year-2 | Year-3 | Year-4 | Year-5 | Year-6 | Year-7 | Year-8 | Year-9 |
|---|---|---|---|---|---|---|---|---|---|---|
| 1980's | 24,805 | 9,518 | 10,712 | 23,401 | 24,072 | 13,921 | ||||
| 1990's | 2,822 | 9,123 | 611 | 0 | 30 | 0 | 0 | 0 | 0 | 0 |
| 2000's | 0 | 651 | 1,042 | 0 | 0 | 0 | -- | 554 | 264 | 134 |
| 2010's | 518 | 1,619 | 1,095 | 1,336 | 502 | 0 | 203 | 0 | 0 | 0 |
| 2020's | 1,343 |
| - = No Data Reported; -- = Not Applicable; NA = Not Available; W = Withheld to avoid disclosure of individual company data. |
| Release Date: 2/9/2022 |
| Next Release Date: Suspended |