|
Download Data (XLS File) |
|
|||||
|
|||||
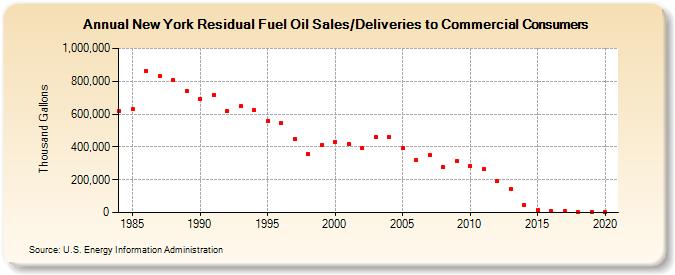
| New York Residual Fuel Oil Sales/Deliveries to Commercial Consumers (Thousand Gallons) | |||||
| Decade | Year-0 | Year-1 | Year-2 | Year-3 | Year-4 | Year-5 | Year-6 | Year-7 | Year-8 | Year-9 |
|---|---|---|---|---|---|---|---|---|---|---|
| 1980's | 619,073 | 628,945 | 864,394 | 829,516 | 804,690 | 742,287 | ||||
| 1990's | 692,131 | 718,192 | 616,789 | 646,136 | 623,200 | 555,716 | 543,869 | 450,968 | 356,962 | 412,137 |
| 2000's | 430,023 | 419,337 | 391,092 | 461,239 | 459,167 | 393,569 | 317,815 | 350,182 | 274,857 | 313,798 |
| 2010's | 284,555 | 262,636 | 191,861 | 143,293 | 45,874 | 14,206 | 9,216 | 6,954 | 4,376 | 3,040 |
| 2020's | 2,094 |
| - = No Data Reported; -- = Not Applicable; NA = Not Available; W = Withheld to avoid disclosure of individual company data. |
| Release Date: 2/9/2022 |
| Next Release Date: Suspended |