|
Download Data (XLS File) |
|
|||||
|
|||||
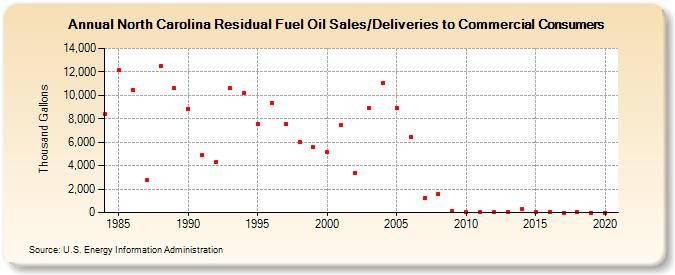
| North Carolina Residual Fuel Oil Sales/Deliveries to Commercial Consumers (Thousand Gallons) | |||||
| Decade | Year-0 | Year-1 | Year-2 | Year-3 | Year-4 | Year-5 | Year-6 | Year-7 | Year-8 | Year-9 |
|---|---|---|---|---|---|---|---|---|---|---|
| 1980's | 8,399 | 12,141 | 10,431 | 2,748 | 12,506 | 10,588 | ||||
| 1990's | 8,865 | 4,942 | 4,344 | 10,614 | 10,230 | 7,592 | 9,340 | 7,538 | 6,015 | 5,553 |
| 2000's | 5,135 | 7,434 | 3,356 | 8,907 | 11,076 | 8,943 | 6,456 | 1,224 | 1,619 | 95 |
| 2010's | 20 | 48 | 18 | 75 | 314 | 53 | 57 | 0 | 32 | 0 |
| 2020's | 0 |
| - = No Data Reported; -- = Not Applicable; NA = Not Available; W = Withheld to avoid disclosure of individual company data. |
| Release Date: 2/9/2022 |
| Next Release Date: Suspended |