|
Download Data (XLS File) |
|
|||||
|
|||||
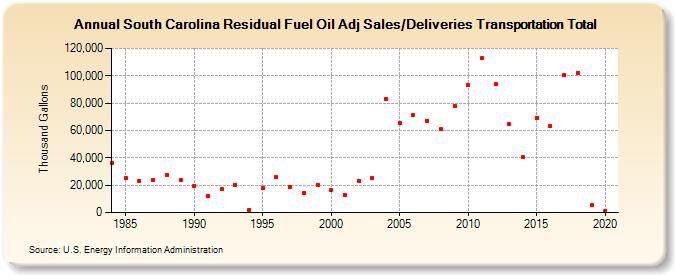
| South Carolina Residual Fuel Oil Adj Sales/Deliveries Transportation Total (Thousand Gallons) | |||||
| Decade | Year-0 | Year-1 | Year-2 | Year-3 | Year-4 | Year-5 | Year-6 | Year-7 | Year-8 | Year-9 |
|---|---|---|---|---|---|---|---|---|---|---|
| 1980's | 36,530 | 25,132 | 23,360 | 23,698 | 27,789 | 23,821 | ||||
| 1990's | 19,557 | 12,280 | 17,258 | 20,141 | 1,729 | 17,769 | 25,732 | 18,704 | 14,374 | 20,056 |
| 2000's | 16,436 | 13,088 | 22,936 | 24,913 | 83,357 | 65,262 | 71,588 | 67,182 | 60,738 | 77,889 |
| 2010's | 93,043 | 112,815 | 93,822 | 64,943 | 40,467 | 69,475 | 63,448 | 100,430 | 102,364 | 5,606 |
| 2020's | 1,356 |
| - = No Data Reported; -- = Not Applicable; NA = Not Available; W = Withheld to avoid disclosure of individual company data. |
| Release Date: 2/9/2022 |
| Next Release Date: Suspended |