|
Download Data (XLS File) |
|
|||||
|
|||||
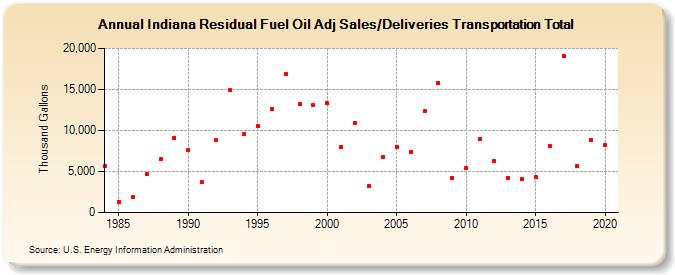
| Indiana Residual Fuel Oil Adj Sales/Deliveries Transportation Total (Thousand Gallons) | |||||
| Decade | Year-0 | Year-1 | Year-2 | Year-3 | Year-4 | Year-5 | Year-6 | Year-7 | Year-8 | Year-9 |
|---|---|---|---|---|---|---|---|---|---|---|
| 1980's | 5,657 | 1,302 | 1,842 | 4,733 | 6,477 | 9,122 | ||||
| 1990's | 7,649 | 3,769 | 8,820 | 14,880 | 9,548 | 10,517 | 12,674 | 16,835 | 13,180 | 13,048 |
| 2000's | 13,300 | 8,003 | 10,933 | 3,229 | 6,731 | 8,016 | 7,396 | 12,334 | 15,785 | 4,234 |
| 2010's | 5,421 | 8,962 | 6,240 | 4,252 | 4,053 | 4,273 | 8,131 | 19,084 | 5,623 | 8,879 |
| 2020's | 8,241 |
| - = No Data Reported; -- = Not Applicable; NA = Not Available; W = Withheld to avoid disclosure of individual company data. |
| Release Date: 2/9/2022 |
| Next Release Date: Suspended |