|
Download Data (XLS File) |
|
|||||
|
|||||
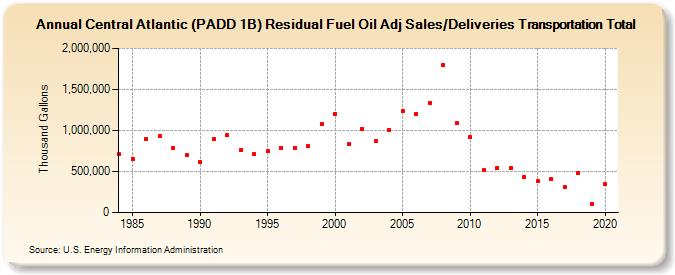
| Central Atlantic (PADD 1B) Residual Fuel Oil Adj Sales/Deliveries Transportation Total (Thousand Gallons) | |||||
| Decade | Year-0 | Year-1 | Year-2 | Year-3 | Year-4 | Year-5 | Year-6 | Year-7 | Year-8 | Year-9 |
|---|---|---|---|---|---|---|---|---|---|---|
| 1980's | 709,353 | 653,486 | 900,714 | 930,234 | 786,634 | 698,609 | ||||
| 1990's | 621,947 | 899,190 | 941,361 | 762,736 | 715,148 | 744,913 | 788,155 | 786,100 | 805,210 | 1,076,828 |
| 2000's | 1,201,171 | 834,169 | 1,022,758 | 875,379 | 1,009,037 | 1,231,564 | 1,206,626 | 1,335,521 | 1,795,283 | 1,090,087 |
| 2010's | 916,627 | 513,836 | 548,652 | 543,709 | 434,132 | 380,470 | 403,271 | 307,337 | 485,593 | 109,890 |
| 2020's | 346,798 |
| - = No Data Reported; -- = Not Applicable; NA = Not Available; W = Withheld to avoid disclosure of individual company data. |
| Release Date: 2/9/2022 |
| Next Release Date: Suspended |