|
Download Data (XLS File) |
|
|||||
|
|||||
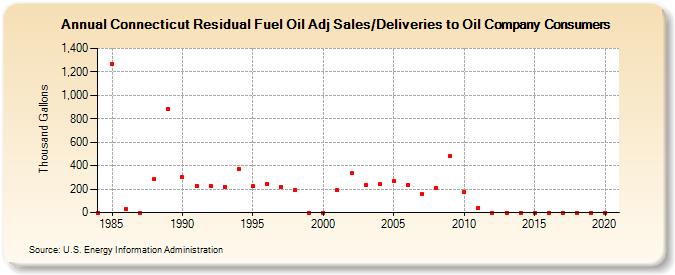
| Connecticut Residual Fuel Oil Adj Sales/Deliveries to Oil Company Consumers (Thousand Gallons) | |||||
| Decade | Year-0 | Year-1 | Year-2 | Year-3 | Year-4 | Year-5 | Year-6 | Year-7 | Year-8 | Year-9 |
|---|---|---|---|---|---|---|---|---|---|---|
| 1980's | 0 | 1,270 | 29 | 0 | 284 | 887 | ||||
| 1990's | 301 | 225 | 228 | 222 | 368 | 226 | 247 | 222 | 193 | 0 |
| 2000's | 0 | 189 | 335 | 231 | 241 | 267 | 233 | 160 | 212 | 480 |
| 2010's | 172 | 42 | 0 | 0 | 0 | 0 | 0 | 0 | 0 | 0 |
| 2020's | 0 |
| - = No Data Reported; -- = Not Applicable; NA = Not Available; W = Withheld to avoid disclosure of individual company data. |
| Release Date: 2/9/2022 |
| Next Release Date: Suspended |