|
Download Data (XLS File) |
|
|||||
|
|||||
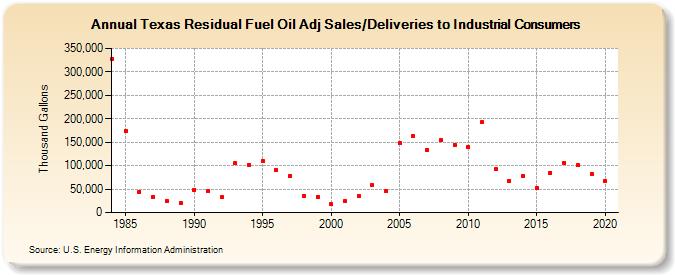
| Texas Residual Fuel Oil Adj Sales/Deliveries to Industrial Consumers (Thousand Gallons) | |||||
| Decade | Year-0 | Year-1 | Year-2 | Year-3 | Year-4 | Year-5 | Year-6 | Year-7 | Year-8 | Year-9 |
|---|---|---|---|---|---|---|---|---|---|---|
| 1980's | 327,818 | 174,087 | 44,619 | 33,465 | 24,652 | 21,186 | ||||
| 1990's | 48,909 | 45,599 | 32,544 | 104,637 | 101,532 | 109,932 | 90,565 | 78,825 | 35,781 | 33,711 |
| 2000's | 17,684 | 24,266 | 35,045 | 59,097 | 45,040 | 147,776 | 163,708 | 134,133 | 153,936 | 144,952 |
| 2010's | 139,738 | 192,400 | 92,626 | 68,336 | 78,267 | 52,279 | 84,922 | 106,446 | 100,609 | 82,593 |
| 2020's | 66,769 |
| - = No Data Reported; -- = Not Applicable; NA = Not Available; W = Withheld to avoid disclosure of individual company data. |
| Release Date: 2/9/2022 |
| Next Release Date: Suspended |