|
Download Data (XLS File) |
|
|||||
|
|||||
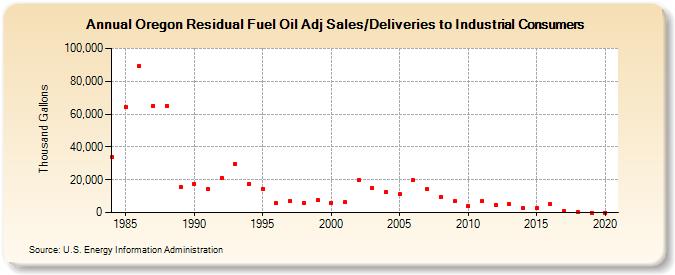
| Oregon Residual Fuel Oil Adj Sales/Deliveries to Industrial Consumers (Thousand Gallons) | |||||
| Decade | Year-0 | Year-1 | Year-2 | Year-3 | Year-4 | Year-5 | Year-6 | Year-7 | Year-8 | Year-9 |
|---|---|---|---|---|---|---|---|---|---|---|
| 1980's | 33,631 | 64,317 | 89,344 | 65,203 | 65,164 | 15,575 | ||||
| 1990's | 17,492 | 14,593 | 21,352 | 29,580 | 17,701 | 14,534 | 5,784 | 7,083 | 6,050 | 7,601 |
| 2000's | 6,062 | 6,260 | 19,851 | 14,738 | 12,627 | 11,116 | 19,539 | 14,105 | 9,396 | 6,832 |
| 2010's | 4,095 | 6,892 | 4,687 | 5,001 | 2,531 | 2,672 | 5,059 | 898 | 612 | 0 |
| 2020's | 0 |
| - = No Data Reported; -- = Not Applicable; NA = Not Available; W = Withheld to avoid disclosure of individual company data. |
| Release Date: 2/9/2022 |
| Next Release Date: Suspended |