|
Download Data (XLS File) |
|
|||||
|
|||||
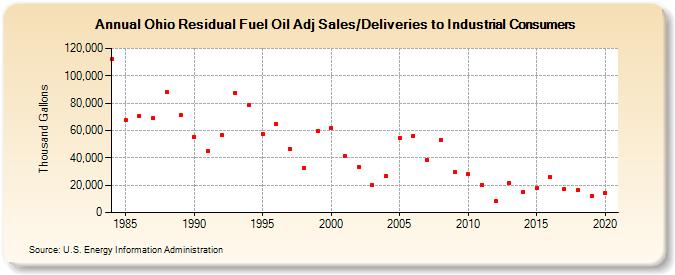
| Ohio Residual Fuel Oil Adj Sales/Deliveries to Industrial Consumers (Thousand Gallons) | |||||
| Decade | Year-0 | Year-1 | Year-2 | Year-3 | Year-4 | Year-5 | Year-6 | Year-7 | Year-8 | Year-9 |
|---|---|---|---|---|---|---|---|---|---|---|
| 1980's | 112,000 | 67,385 | 70,790 | 68,861 | 87,855 | 70,968 | ||||
| 1990's | 55,500 | 44,655 | 56,893 | 87,668 | 78,427 | 57,582 | 64,457 | 46,490 | 32,706 | 59,738 |
| 2000's | 61,940 | 41,421 | 33,630 | 20,280 | 26,683 | 54,826 | 56,202 | 38,123 | 53,338 | 29,468 |
| 2010's | 27,830 | 20,412 | 8,441 | 21,471 | 14,826 | 17,839 | 25,859 | 17,347 | 16,237 | 11,964 |
| 2020's | 14,404 |
| - = No Data Reported; -- = Not Applicable; NA = Not Available; W = Withheld to avoid disclosure of individual company data. |
| Release Date: 2/9/2022 |
| Next Release Date: Suspended |