|
Download Data (XLS File) |
|
|||||
|
|||||
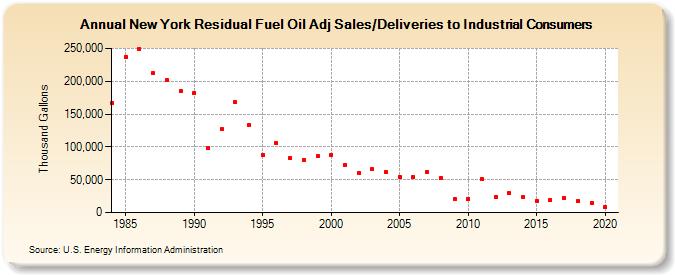
| New York Residual Fuel Oil Adj Sales/Deliveries to Industrial Consumers (Thousand Gallons) | |||||
| Decade | Year-0 | Year-1 | Year-2 | Year-3 | Year-4 | Year-5 | Year-6 | Year-7 | Year-8 | Year-9 |
|---|---|---|---|---|---|---|---|---|---|---|
| 1980's | 166,158 | 237,643 | 249,457 | 211,896 | 201,654 | 185,421 | ||||
| 1990's | 181,958 | 98,329 | 127,230 | 167,682 | 132,759 | 87,863 | 105,418 | 82,958 | 80,709 | 85,388 |
| 2000's | 87,653 | 71,753 | 59,968 | 65,790 | 61,181 | 54,906 | 53,772 | 62,126 | 52,643 | 20,046 |
| 2010's | 21,033 | 51,786 | 24,154 | 29,303 | 23,222 | 18,142 | 19,320 | 22,812 | 17,386 | 15,164 |
| 2020's | 8,191 |
| - = No Data Reported; -- = Not Applicable; NA = Not Available; W = Withheld to avoid disclosure of individual company data. |
| Release Date: 2/9/2022 |
| Next Release Date: Suspended |