|
Download Data (XLS File) |
|
|||||
|
|||||
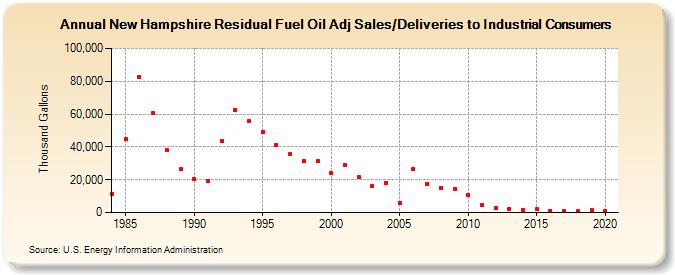
| New Hampshire Residual Fuel Oil Adj Sales/Deliveries to Industrial Consumers (Thousand Gallons) | |||||
| Decade | Year-0 | Year-1 | Year-2 | Year-3 | Year-4 | Year-5 | Year-6 | Year-7 | Year-8 | Year-9 |
|---|---|---|---|---|---|---|---|---|---|---|
| 1980's | 11,591 | 44,554 | 82,685 | 60,528 | 38,206 | 26,457 | ||||
| 1990's | 20,511 | 19,408 | 43,747 | 62,655 | 55,815 | 48,895 | 41,421 | 35,381 | 31,167 | 31,470 |
| 2000's | 24,063 | 29,010 | 21,947 | 16,129 | 18,097 | 6,002 | 26,796 | 17,515 | 15,099 | 14,365 |
| 2010's | 10,562 | 4,706 | 2,813 | 2,397 | 1,658 | 1,944 | 1,112 | 807 | 708 | 1,629 |
| 2020's | 979 |
| - = No Data Reported; -- = Not Applicable; NA = Not Available; W = Withheld to avoid disclosure of individual company data. |
| Release Date: 2/9/2022 |
| Next Release Date: Suspended |