|
Download Data (XLS File) |
|
|||||
|
|||||
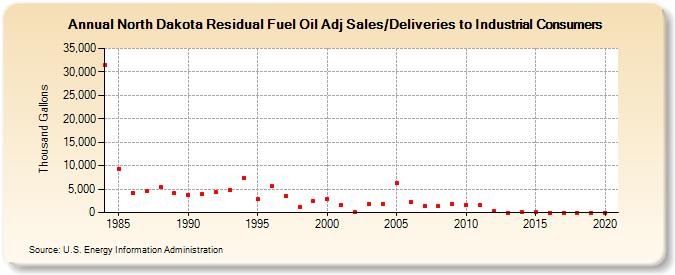
| North Dakota Residual Fuel Oil Adj Sales/Deliveries to Industrial Consumers (Thousand Gallons) | |||||
| Decade | Year-0 | Year-1 | Year-2 | Year-3 | Year-4 | Year-5 | Year-6 | Year-7 | Year-8 | Year-9 |
|---|---|---|---|---|---|---|---|---|---|---|
| 1980's | 31,466 | 9,387 | 4,237 | 4,562 | 5,413 | 4,102 | ||||
| 1990's | 3,839 | 4,056 | 4,325 | 4,835 | 7,410 | 2,833 | 5,604 | 3,481 | 1,196 | 2,449 |
| 2000's | 2,891 | 1,550 | 168 | 1,795 | 1,862 | 6,234 | 2,166 | 1,408 | 1,304 | 1,764 |
| 2010's | 1,618 | 1,667 | 303 | 0 | 23 | 26 | 0 | 0 | 0 | 0 |
| 2020's | 0 |
| - = No Data Reported; -- = Not Applicable; NA = Not Available; W = Withheld to avoid disclosure of individual company data. |
| Release Date: 2/9/2022 |
| Next Release Date: Suspended |