|
Download Data (XLS File) |
|
|||||
|
|||||
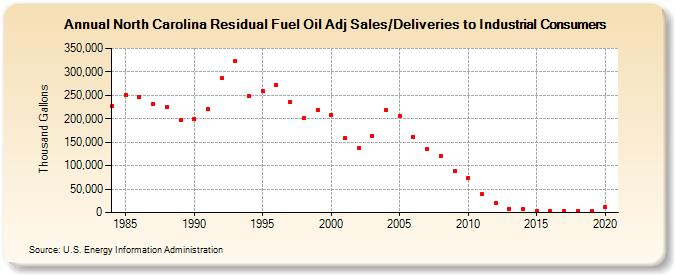
| North Carolina Residual Fuel Oil Adj Sales/Deliveries to Industrial Consumers (Thousand Gallons) | |||||
| Decade | Year-0 | Year-1 | Year-2 | Year-3 | Year-4 | Year-5 | Year-6 | Year-7 | Year-8 | Year-9 |
|---|---|---|---|---|---|---|---|---|---|---|
| 1980's | 227,237 | 251,326 | 247,415 | 231,628 | 225,538 | 196,533 | ||||
| 1990's | 199,319 | 220,654 | 286,587 | 322,612 | 249,517 | 258,785 | 271,839 | 236,356 | 200,893 | 219,238 |
| 2000's | 207,916 | 158,690 | 137,737 | 164,164 | 218,397 | 205,361 | 161,377 | 134,797 | 121,327 | 88,544 |
| 2010's | 74,443 | 38,702 | 19,459 | 8,314 | 6,891 | 3,132 | 2,352 | 3,519 | 3,493 | 2,328 |
| 2020's | 11,645 |
| - = No Data Reported; -- = Not Applicable; NA = Not Available; W = Withheld to avoid disclosure of individual company data. |
| Release Date: 2/9/2022 |
| Next Release Date: Suspended |