|
Download Data (XLS File) |
|
|||||
|
|||||
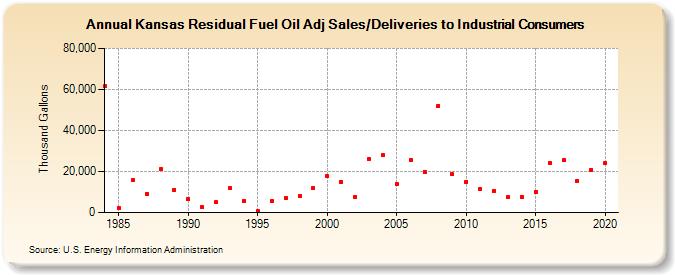
| Kansas Residual Fuel Oil Adj Sales/Deliveries to Industrial Consumers (Thousand Gallons) | |||||
| Decade | Year-0 | Year-1 | Year-2 | Year-3 | Year-4 | Year-5 | Year-6 | Year-7 | Year-8 | Year-9 |
|---|---|---|---|---|---|---|---|---|---|---|
| 1980's | 61,458 | 2,117 | 15,716 | 9,224 | 21,135 | 11,120 | ||||
| 1990's | 6,487 | 2,679 | 5,108 | 11,793 | 5,805 | 821 | 5,740 | 7,148 | 8,008 | 11,862 |
| 2000's | 17,676 | 14,803 | 7,660 | 26,195 | 27,876 | 13,899 | 25,840 | 19,953 | 52,048 | 18,574 |
| 2010's | 15,025 | 11,338 | 10,704 | 7,383 | 7,587 | 10,243 | 24,300 | 25,402 | 15,335 | 20,930 |
| 2020's | 23,987 |
| - = No Data Reported; -- = Not Applicable; NA = Not Available; W = Withheld to avoid disclosure of individual company data. |
| Release Date: 2/9/2022 |
| Next Release Date: Suspended |