|
Download Data (XLS File) |
|
|||||
|
|||||
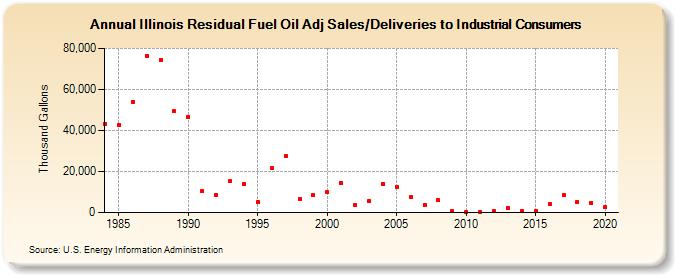
| Illinois Residual Fuel Oil Adj Sales/Deliveries to Industrial Consumers (Thousand Gallons) | |||||
| Decade | Year-0 | Year-1 | Year-2 | Year-3 | Year-4 | Year-5 | Year-6 | Year-7 | Year-8 | Year-9 |
|---|---|---|---|---|---|---|---|---|---|---|
| 1980's | 43,314 | 42,563 | 54,043 | 76,367 | 74,249 | 49,340 | ||||
| 1990's | 46,717 | 10,475 | 8,451 | 15,155 | 14,012 | 5,031 | 21,581 | 27,604 | 6,528 | 8,328 |
| 2000's | 10,096 | 14,387 | 3,856 | 5,541 | 14,002 | 12,649 | 7,497 | 3,636 | 6,117 | 534 |
| 2010's | 161 | 442 | 523 | 2,162 | 865 | 616 | 4,136 | 8,540 | 5,123 | 4,821 |
| 2020's | 2,483 |
| - = No Data Reported; -- = Not Applicable; NA = Not Available; W = Withheld to avoid disclosure of individual company data. |
| Release Date: 2/9/2022 |
| Next Release Date: Suspended |