|
Download Data (XLS File) |
|
|||||
|
|||||
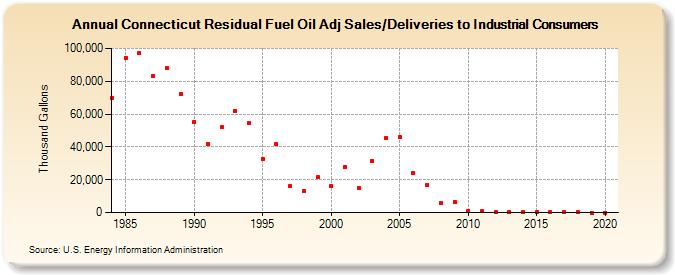
| Connecticut Residual Fuel Oil Adj Sales/Deliveries to Industrial Consumers (Thousand Gallons) | |||||
| Decade | Year-0 | Year-1 | Year-2 | Year-3 | Year-4 | Year-5 | Year-6 | Year-7 | Year-8 | Year-9 |
|---|---|---|---|---|---|---|---|---|---|---|
| 1980's | 69,898 | 94,324 | 97,140 | 83,206 | 87,765 | 72,088 | ||||
| 1990's | 55,201 | 41,667 | 51,874 | 62,104 | 54,741 | 32,844 | 41,475 | 16,105 | 13,103 | 21,434 |
| 2000's | 16,474 | 27,635 | 14,858 | 31,603 | 45,561 | 45,744 | 24,206 | 16,687 | 5,952 | 6,678 |
| 2010's | 876 | 663 | 347 | 179 | 191 | 278 | 71 | 90 | 90 | 0 |
| 2020's | 0 |
| - = No Data Reported; -- = Not Applicable; NA = Not Available; W = Withheld to avoid disclosure of individual company data. |
| Release Date: 2/9/2022 |
| Next Release Date: Suspended |