|
Download Data (XLS File) |
|
|||||
|
|||||
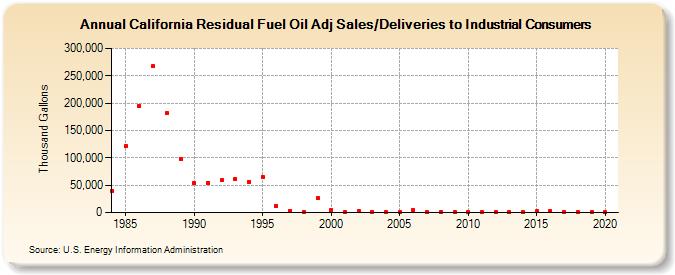
| California Residual Fuel Oil Adj Sales/Deliveries to Industrial Consumers (Thousand Gallons) | |||||
| Decade | Year-0 | Year-1 | Year-2 | Year-3 | Year-4 | Year-5 | Year-6 | Year-7 | Year-8 | Year-9 |
|---|---|---|---|---|---|---|---|---|---|---|
| 1980's | 39,757 | 121,578 | 195,529 | 267,032 | 181,656 | 98,460 | ||||
| 1990's | 53,290 | 54,038 | 58,961 | 61,605 | 56,564 | 65,537 | 11,687 | 3,452 | 1,318 | 26,451 |
| 2000's | 4,747 | 750 | 2,148 | 1,508 | 583 | 465 | 4,239 | 452 | 1,905 | 273 |
| 2010's | 436 | 299 | 234 | 256 | 218 | 1,940 | 2,424 | 798 | 440 | 455 |
| 2020's | 400 |
| - = No Data Reported; -- = Not Applicable; NA = Not Available; W = Withheld to avoid disclosure of individual company data. |
| Release Date: 2/9/2022 |
| Next Release Date: Suspended |