|
Download Data (XLS File) |
|
|||||
|
|||||
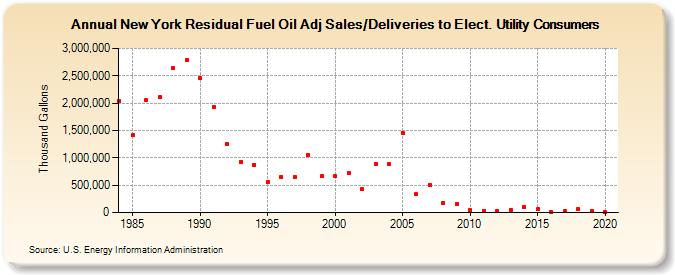
| New York Residual Fuel Oil Adj Sales/Deliveries to Elect. Utility Consumers (Thousand Gallons) | |||||
| Decade | Year-0 | Year-1 | Year-2 | Year-3 | Year-4 | Year-5 | Year-6 | Year-7 | Year-8 | Year-9 |
|---|---|---|---|---|---|---|---|---|---|---|
| 1980's | 2,035,727 | 1,411,672 | 2,051,424 | 2,106,237 | 2,642,176 | 2,784,305 | ||||
| 1990's | 2,450,991 | 1,938,104 | 1,257,902 | 927,389 | 874,658 | 567,114 | 655,673 | 651,476 | 1,048,993 | 659,514 |
| 2000's | 661,486 | 715,560 | 427,832 | 890,940 | 878,589 | 1,460,535 | 333,091 | 505,845 | 181,766 | 156,177 |
| 2010's | 41,634 | 36,388 | 26,347 | 43,270 | 100,178 | 57,464 | 14,808 | 23,240 | 58,277 | 21,583 |
| 2020's | 5,695 |
| - = No Data Reported; -- = Not Applicable; NA = Not Available; W = Withheld to avoid disclosure of individual company data. |
| Release Date: 2/9/2022 |
| Next Release Date: Suspended |