|
Download Data (XLS File) |
|
|||||
|
|||||
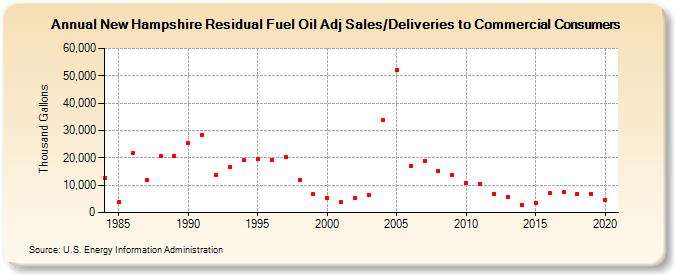
| New Hampshire Residual Fuel Oil Adj Sales/Deliveries to Commercial Consumers (Thousand Gallons) | |||||
| Decade | Year-0 | Year-1 | Year-2 | Year-3 | Year-4 | Year-5 | Year-6 | Year-7 | Year-8 | Year-9 |
|---|---|---|---|---|---|---|---|---|---|---|
| 1980's | 12,732 | 3,773 | 21,839 | 11,858 | 20,513 | 20,573 | ||||
| 1990's | 25,444 | 28,416 | 13,825 | 16,631 | 19,100 | 19,518 | 19,356 | 20,221 | 12,048 | 6,682 |
| 2000's | 5,487 | 3,844 | 5,485 | 6,436 | 33,871 | 52,256 | 17,055 | 18,989 | 15,192 | 13,858 |
| 2010's | 10,765 | 10,484 | 6,847 | 5,688 | 2,817 | 3,622 | 7,101 | 7,466 | 6,774 | 6,851 |
| 2020's | 4,695 |
| - = No Data Reported; -- = Not Applicable; NA = Not Available; W = Withheld to avoid disclosure of individual company data. |
| Release Date: 2/9/2022 |
| Next Release Date: Suspended |