|
Download Data (XLS File) |
|
|||||
|
|||||
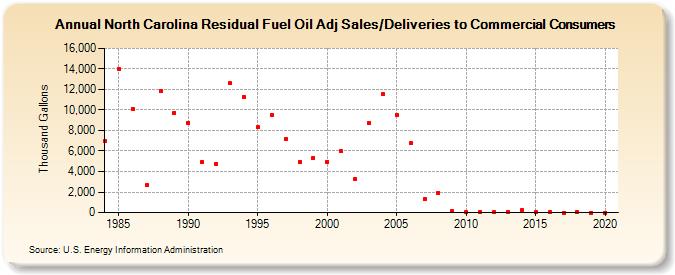
| North Carolina Residual Fuel Oil Adj Sales/Deliveries to Commercial Consumers (Thousand Gallons) | |||||
| Decade | Year-0 | Year-1 | Year-2 | Year-3 | Year-4 | Year-5 | Year-6 | Year-7 | Year-8 | Year-9 |
|---|---|---|---|---|---|---|---|---|---|---|
| 1980's | 6,943 | 14,010 | 10,078 | 2,642 | 11,859 | 9,748 | ||||
| 1990's | 8,755 | 4,952 | 4,765 | 12,600 | 11,290 | 8,294 | 9,510 | 7,207 | 4,966 | 5,325 |
| 2000's | 4,961 | 5,972 | 3,312 | 8,740 | 11,540 | 9,556 | 6,733 | 1,310 | 1,932 | 110 |
| 2010's | 24 | 55 | 17 | 69 | 244 | 49 | 81 | 0 | 48 | 0 |
| 2020's | 0 |
| - = No Data Reported; -- = Not Applicable; NA = Not Available; W = Withheld to avoid disclosure of individual company data. |
| Release Date: 2/9/2022 |
| Next Release Date: Suspended |