|
Download Data (XLS File) |
|
|||||
|
|||||
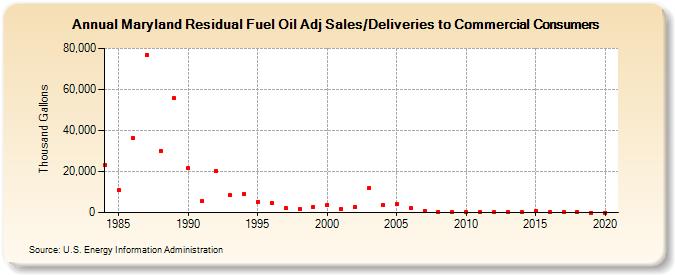
| Maryland Residual Fuel Oil Adj Sales/Deliveries to Commercial Consumers (Thousand Gallons) | |||||
| Decade | Year-0 | Year-1 | Year-2 | Year-3 | Year-4 | Year-5 | Year-6 | Year-7 | Year-8 | Year-9 |
|---|---|---|---|---|---|---|---|---|---|---|
| 1980's | 23,054 | 10,973 | 36,303 | 76,806 | 30,218 | 55,648 | ||||
| 1990's | 21,533 | 5,617 | 20,279 | 8,464 | 9,170 | 5,332 | 4,656 | 2,127 | 1,830 | 2,770 |
| 2000's | 3,829 | 1,584 | 2,812 | 11,747 | 3,625 | 4,095 | 2,002 | 782 | 482 | 123 |
| 2010's | 216 | 186 | 36 | 126 | 127 | 692 | 249 | 220 | 382 | 0 |
| 2020's | 0 |
| - = No Data Reported; -- = Not Applicable; NA = Not Available; W = Withheld to avoid disclosure of individual company data. |
| Release Date: 2/9/2022 |
| Next Release Date: Suspended |